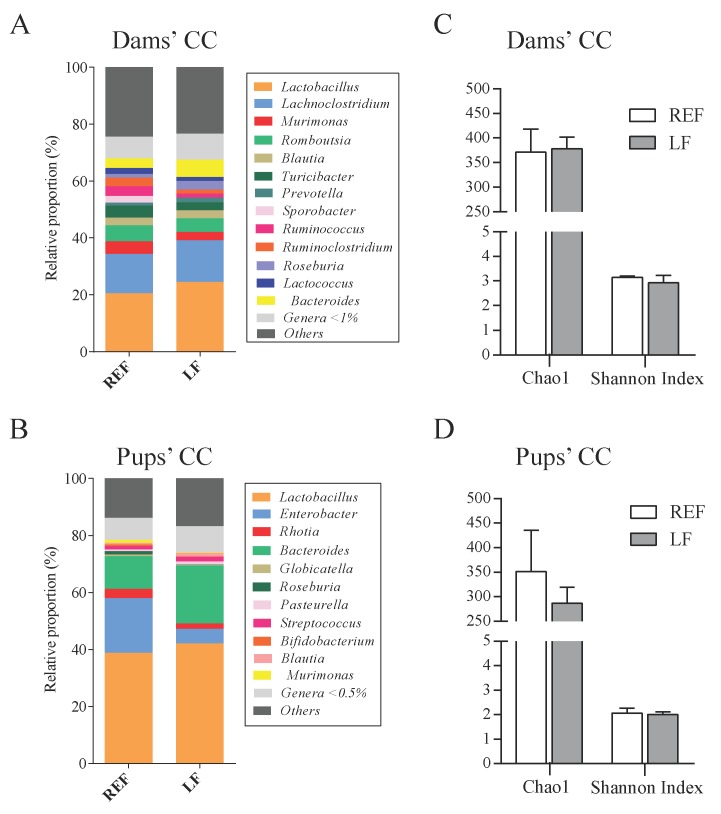
Figure 5.
Cecal microbiota composition of dams’ and pups’ cecal content at L14. The main genera present in the cecal content are represented in stacked bars for (A) dams and (B) pups. Moreover, the richness of species and diversity of genera was analyzed by the calculation of Chao1 and Shannon Index, respectively, both for (C) dams and (D) pups. Results are expressed as mean ± S.E.M. (n = 3 animals/group). REF, reference group; LF, Lactobacillus fermentum CECT5716 group; CC, cecal content.

