Figure 7.
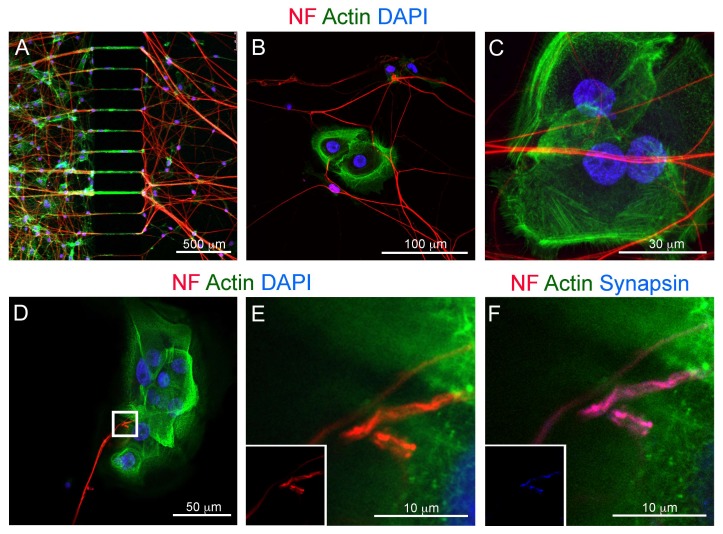
Confocal microscopy imaging of co-cultures of trigeminal ganglia and AB10 ameloblastoma cells. (A) Double immunofluorescent staining against neurofilament (red color) and actin (phalloidin; green color) showing passage of axons from the neuronal culture chamber to the AB10-containing culture chamber. Blue color: DAPI. (B) Double immunofluorescent staining against neurofilament (red color) and actin (phalloidin; green color) showing axonal networks formed by trigeminal neurons in correspondence of AB10 cells. Blue color: DAPI. (C) 3D projection of the innervation of a cluster of AB10 cells. Neurofilament (red color) marks axons and phalloidin (against actin; green color) marks AB10 cells cytoskeleton. Blue color: DAPI. (D) Double immunofluorescent staining against neurofilament (red color) and actin (phalloidin; green color) showing axonal branching and establishment of multiple connections upon contact of trigeminal axons with AB10 cells. Blue color: DAPI. (E) Higher magnification of D (white box in D indicates the region showed in E). Insert shows single channel immunofluorescent staining against neurofilament. (F) Triple immunofluorescent staining against neurofilament (red color), actin (green color) and Synapsin I (blue color) showing accumulation of synapsin at the sites of axon/AB10 cells contact. Insert shows single channel immunofluorescent staining against Synapsin I. Scale bars: (A): 500 µm; (B): 100 µm; (C): 30 µm; (D): 50 µm; (E): 10 µm.

