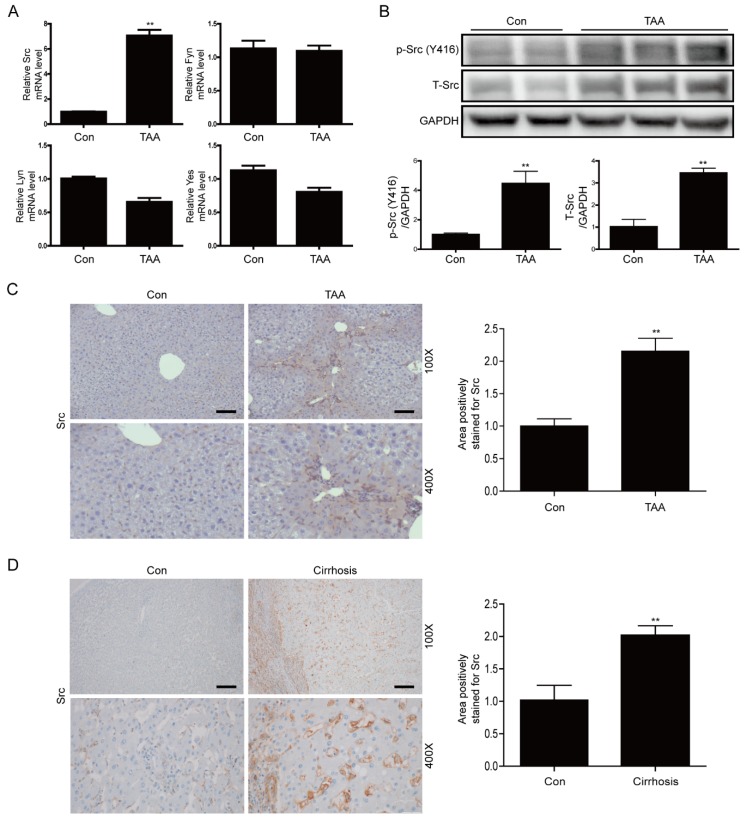
Figure 1.
Expression of Src is elevated in liver tissues of thioacetamide (TAA)-injected mice and cirrhotic livers of patients (A) Representative real-time RT-PCR analysis of mRNA expression of SRC family kinases (Src, Fyn, Lyn, and Yes) in liver tissues of TAA-injected mice. Data in the bar graphs are means ± SEM. ** p < 0.01 compared with the control (Con). (B) Representative western blot analysis of Src and phospho-Src in liver tissues of TAA-injected mice. Data in the bar graphs are means ± SEM. ** p < 0.01 compared with control (Con). (C) Representative images of IHC staining for Src in liver tissues of TAA-injected mice. Areas of positive Src immunostaining were quantified by ImageJ software. All morphometric data of TAA-injected mice livers were normalized against those of the control, and the data in all bar graphs are expressed as fold increases relative to the control. Data in the bar graph are means ± SEM. ** p < 0.01 compared with control (Con). Original magnification ×100, ×400. Scale bars indicate 100 μm. (D) Representative images of IHC staining for Src in cirrhotic liver. Areas of positive Src immunostaining were quantitated by ImageJ software. All morphometric data obtained in cirrhotic liver were normalized against the corresponding values in control (Con), and the data in all bar graphs are expressed as the fold increase relative to the control. Data in the bar graph are means ± SEM. ** p < 0.01 compared with the control. Original magnification ×100, ×400. Scale bars indicate 100 μm.

