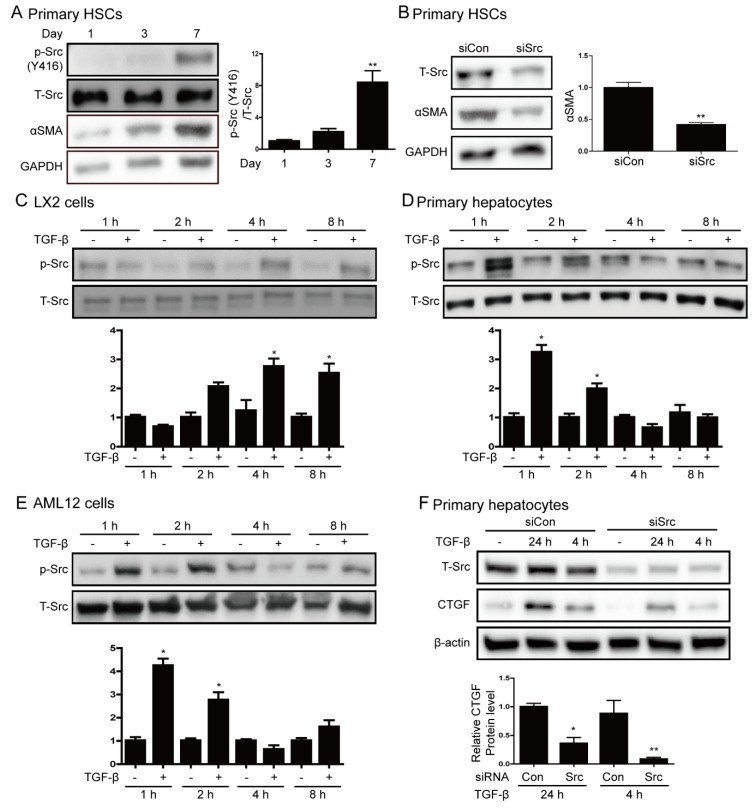
Figure 2.
Src phosphorylation is increased by hepatic stellate cell activation and transforming growth factor β (TGF-β) stimulation. (A) Representative western blot analysis of phospho-Src and αSMA during activation of HSCs. Primary HSCs were cultured in DMEM containing 10% FBS. Data in the bar graphs are means ± SEM. ** p < 0.01 compared with one day. (B) Western blot analysis of the effect of Src depletion on αSMA expression. HSCs cultured for one day were transfected with 100 nM siSrc or control siRNA (siCon) and harvested at sven days. Data in the bar graphs are means ± SEM. ** p < 0.01 as compared with siCon. (C–E) LX2 cells, primary hepatocytes, and AML12 cells were treated with 5 ng/mL TGF-β for the indicated durations. Expression of phospho-Src (Y416) was investigated by western blot analysis. Data in the graph are represented as the mean ± SEM of three independent measurements. * p < 0.05 compared with control for each time. (F) Western blot analysis of the effect of Src depletion on TGF-β-induced connective tissue growth factor (CTGF) protein expression. Primary hepatocytes were transfected with 100 nM siSrc or control siRNA (siCon), and then treated with or without TGF-β. Data in the bar graph are means ± SEM of three independent measurements. * p < 0.05, ** p < 0.01 as compared with TGF-β treatment plus control siRNA.

