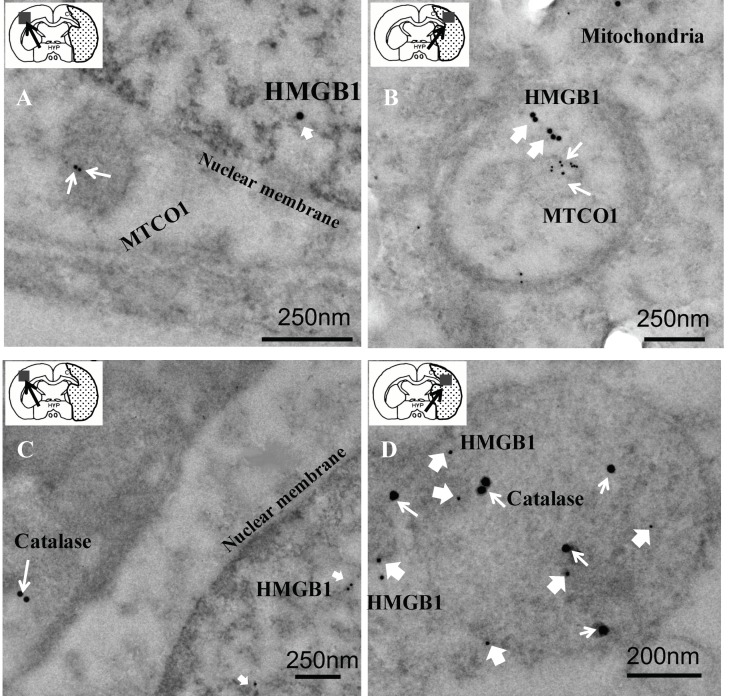
Figure 4.
Electron microscopic immunogold localization studies of HMGB1 and MTCO1 or HMGB1 and catalase in the contralateral or ipsilateral hemisphere portion of the brain tissue sample at 12 h after reperfusion. (A,B) The anti-HMGB1 gold particles (20 nm, thick white arrows) or anti-MTCO1 gold particles (10 nm, thin white arrows) in a representative neuron in the contralateral (scale bar: 250 nm) or ipsilateral (scale bar: 250 nm) hemisphere portion of the brain tissue sample at 12 h after reperfusion, respectively. (C,D) HMGB1 localization visualized using 10 nm gold particles (thick white arrows) and catalase localization visualized using 20 nm (thin white arrows) gold particles in the contralateral (scale bar: 250 nm) or ipsilateral (scale bar: 200 nm) hemisphere portion of the brain tissue sample at 12 h after reperfusion, respectively.

