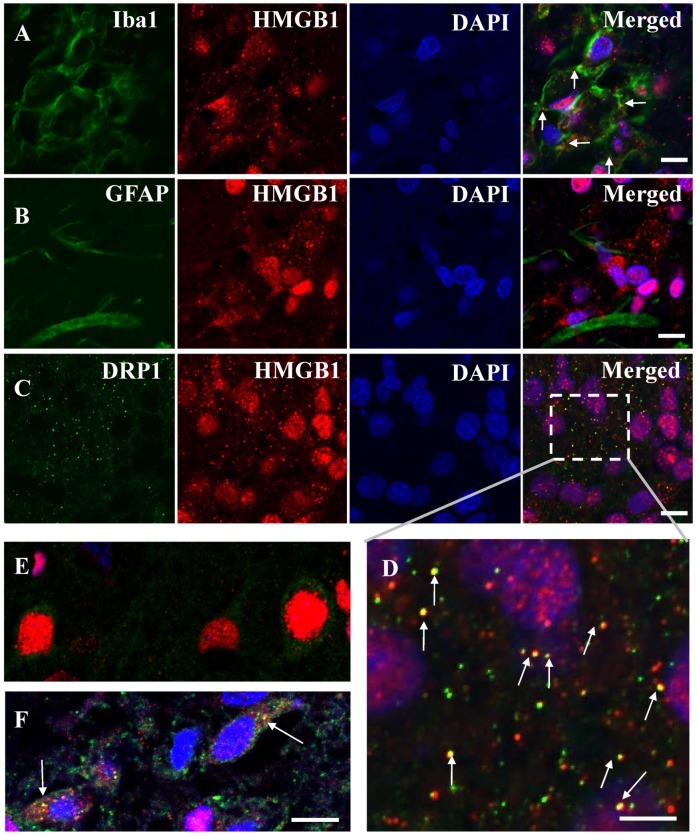
Figure 6.
Immunostaining of HMGB1 with Iba1, GFAP, and Drp1. (A) Iba1 and HMGB1 staining at 10 days post-MCAO. (B) GFAP and HMGB1 staining at 10 days post-MCAO. (C) Drp1 and HMGB1 staining at 10 days post-MCAO. Scale bar: 10 μm. (D) Enlarged image of the boxed area in (C). Scale bar: 5 μm. (E) Drp1 and HMGB1 staining in the cortex of control brain (sham group). (F) Drp1 and HMGB1 staining at 12 h after reperfusion of MCAO. White arrows show the colocalization of HMGB1 and Drp1. Scale bar: 10 μm.

