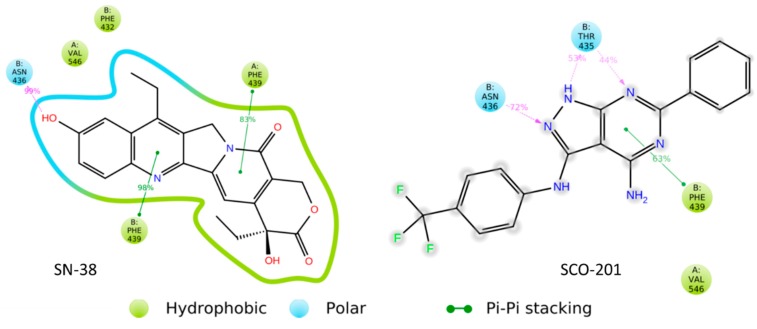
Figure 7.
Binding interactions shown between SN-38 (left) and SCO-201 (right) to the transporter BCRP. Both molecules interacted with the PHE-439 residue of the B chain of BCRP. The interaction percentages indicate accounting for number of frames over the 10 ns simulation where the binding was present. Timetable of ligand–protein interactions are available in Figures S7 and S8. Interactions shown were present in over 30% of the simulation frames. Graphical representation was produced using Desmond, Schrödinger, 2019-3, LLC [43].

