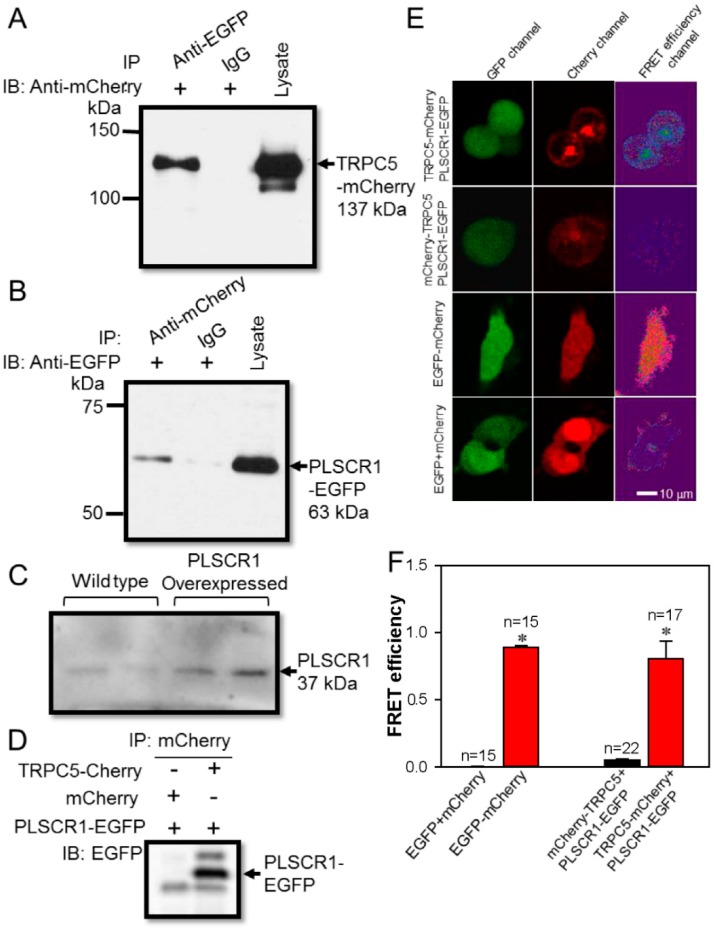
Figure 1.
Association between TRPC5 and PLSCR1 in HEK293 cells. (A, B) Representative images of co-immunoprecipitation experiments in TRPC5-mCherry and PLSCR1-EGFP co-expressing HEK293 cells. (A): IP, anti-EGFP antibody or IgG; IB, anti-mCherry antibody. (B), IP, anti-mCherry antibody or IgG; IB, anti-EGFP antibody. Immunoblots of cell lysates were also shown on the right. (C) Representative images showing the expression of PLSCR1 in wild-type and PLSCR1-overexpressing HEK293 cells. (D) Representative images of co-immunoprecipitation experiments in HEK293 cells co-expressed with mCherry plus PLSCR1-EGFP, or with TRPC5-mCherry plus PLSCR1-EGFP. IP, mCherry antibody; IB, anti-EGFP antibody. (E) Representative images showing fluorescence signals in a FRET assay. HEK293 cells were overexpressed with different constructs as indicated. TRPC5-mCherry, mCherry tagged at the carboxyl terminus of TRPC5; mCherry-TRPC5, mCherry tagged at the amino terminus of TRPC5; PLSCR1-EGFP, EGFP tagged at the carboxyl terminus of PLSCR1. The EGFP emission signal was detected as green fluorescence (GFP channel), while the mCherry emission signal was detected as red fluorescence (Cherry channel). The FRET efficiency fluorescence was shown in the FRET efficiency channel. (F) Summary of data showing the differences in FRET efficiency. Values are shown as the mean ± SEM (n = 15–22); *p < 0.05 for EGFP + mCherry vs. EGFP-mCherry, or mCherry-TRPC5 + PLSCR1-EGFP vs. TRPC5-mCherry + PLSCR1-EGFP with a two-tailed unpaired Student’s t test.

