Figure 3.
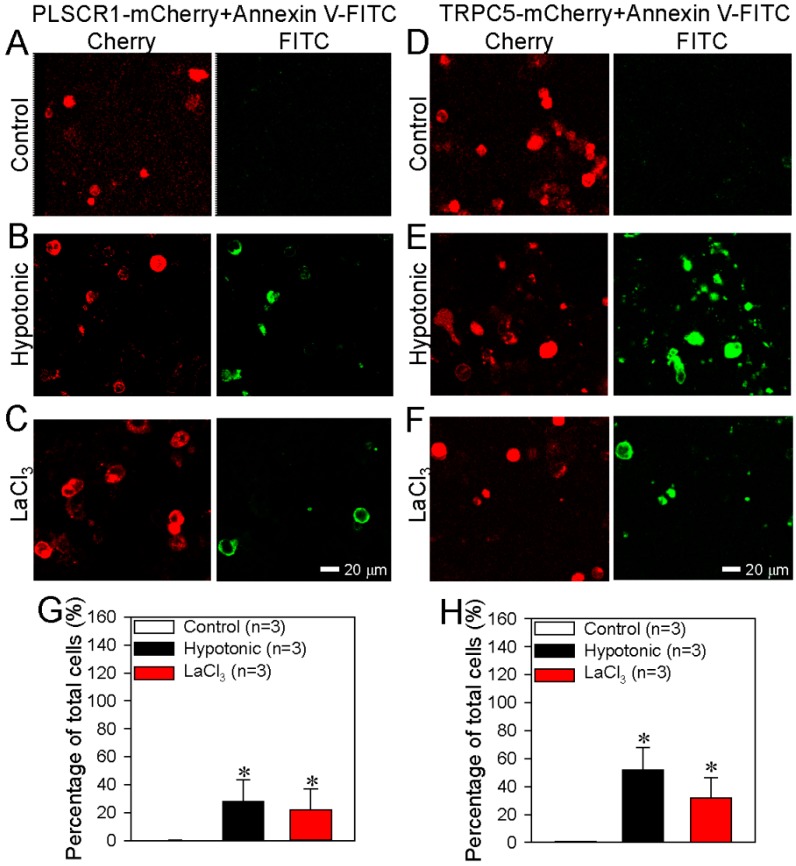
Effect of PLSCR1 alone or TRPC5 alone on phosphatidylserine (PS) externalization in HEK293 cells. (A–F) Representative images showing the expression of PLSCR1-mCherry or TRPC5-mCherry and PS externalization on the plasma membrane of HEK293 cells transfected with PLSCR1-mCherry alone (A–C) or TRPC5-mCherry alone (D–F). The cells were treated with saline (control) (A, D), hypotonic solution (B, E) or LaCl3 (100 μmol/L) (C, F). (G–H) Summary data showing the PS externalized cells (FITC-positive) in percentage of total cells (%). G: data from FITC channel in A–C; H: data from FITC channel in D–F. PS externalization was detected as green fluorescence via the annexin V-FITC assay. PLSCR1 (A–C) and TRPC5 (D–F) are detected as red fluorescence. Values are shown as the mean ± SEM (n = 3); *p < 0.05 for Control vs. Hypotonic or LaCl3 with a two-tailed unpaired Student’s t test.

