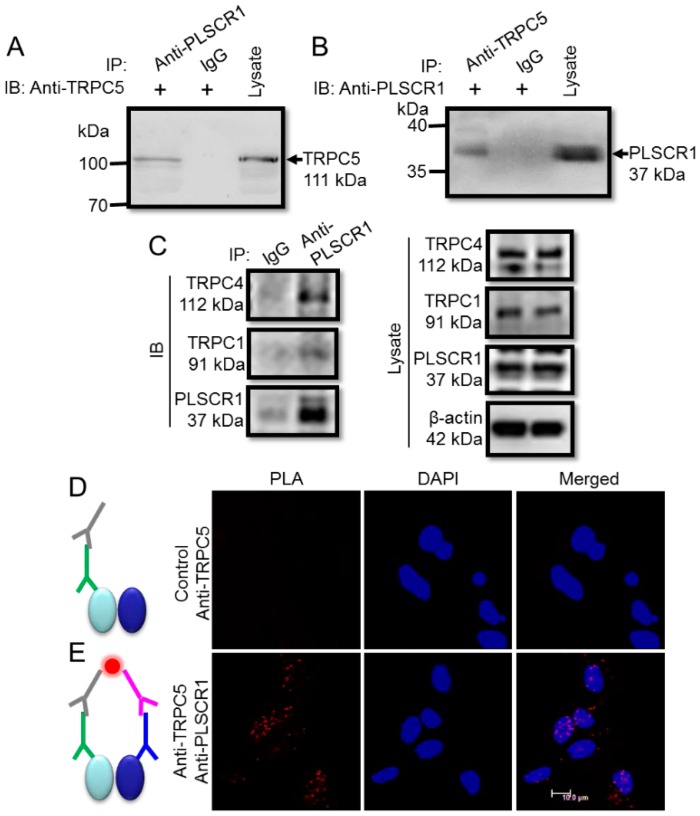
Figure 5.
Association between TRPC5 and PLSCR1 in freshly isolated mouse cortical neurons. (A, B) Representative images of co-immunoprecipitation experiments. (A): IP, anti-PLSCR1 antibody or IgG; IB, anti-TRPC5 antibody. B, IP, anti-TRPC5 antibody or IgG; IB, anti-PLSCR1 antibody. Immunoblots of cell lysates were also shown on the right. (A), immunoblot with rabbit anti-TRPC5 antibody; (B), immunoblot with goat anti-PLSCR1 antibody). The experiments were repeated for three times. (C) Representative images of co-immunoprecipitation experiments. Right: IP, anti-PLSCR1 antibody or IgG; IB, anti-TRPC1, anti-TRPC4, or anti-PLSCR1 antibody. Left, Immunoblots of cell lysates were also shown. (D, E) In situ proximity ligation assay (PLA) to identify the association between TRPC5 and PLSCR1 in native neurons. Representative images were in the presence of both anti-TRPC5 and anti-PLSCR1 antibodies (E), or in the presence of anti-TRPC5 antibody alone (Control) (D). In D and E, gray sign: anti-goat PLA probe Plus, green sign: goat anti-TRPC5 antibody, pink sign: anti-rabbit PLA probe Minus, blue sign: rabbit anti-PLSCR1 antibody, red dot: PLA signal, left oval: TRPC5 protein, right oval: PLSCR1 protein. Nuclei were stained blue by DAPI.

