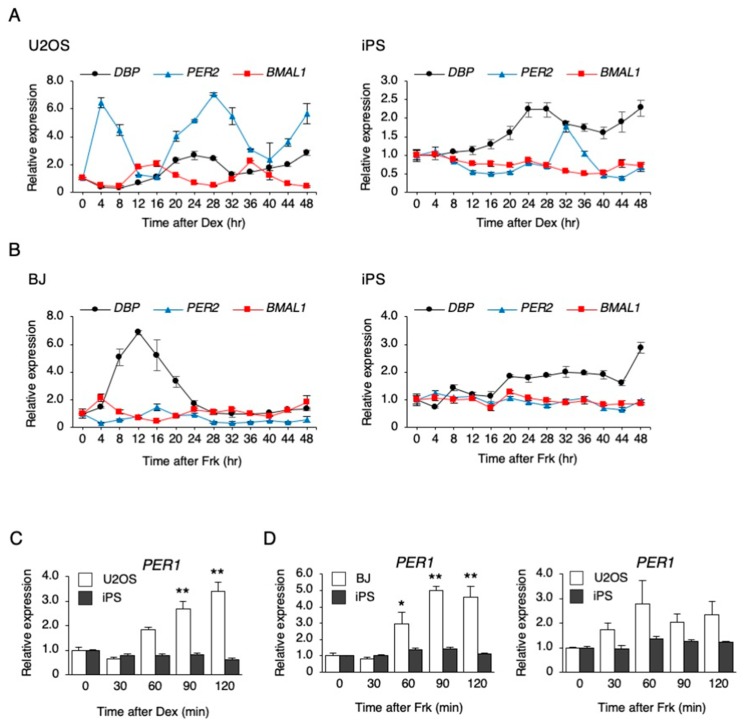
Figure 1.
The response of clock genes to synchronizing stimulations in human-induced pluripotent stem cells (hiPSCs). (A) The expression levels of clock genes every 4 h after dexamethasone (Dex) stimulation in U2OS cells and hiPSCs. Data are presented as the means ± SEM relative to 0 h; n = 3 for each comparison. P values for the rhythmicity of DBP, PER2, and BMAL1 were determined by a cosinor analysis as p = 0.08, p = 0.02, and p < 0.01 in U2OS cells, and p = 0.54, p = 0.03, and p = 0.11 in hiPSCs. (B) The expression levels of clock genes every 4 h after forskolin (Frk) stimulation in BJ cells and hiPSCs. Data are presented as the means ± SEM relative to 0 h; n = 3 for each comparison. p values for the rhythmicity of DBP, PER2, and BMAL1 were determined by a cosinor analysis as p = 0.26, p = 0.29, and p = 0.02 in BJ cells, and p = 0.89, p = 0.21, and p = 0.59 in hiPSCs. (C) The expression level of PER1 after treatment with 0.1 µM Dex in U2OS cells and hiPSCs. Data are presented as the means ± SEM relative to each 0 h. n = 3 for each comparison. ** p < 0.01 versus the corresponding control. (D) The expression level of PER1 after treatment with 10 µM Frk in BJ, U2OS cells, and hiPSCs. Data are presented as the means ± SEM relative to each 0 h; n = 3 for each comparison. * p < 0.05, ** p < 0.01 versus the corresponding control.

