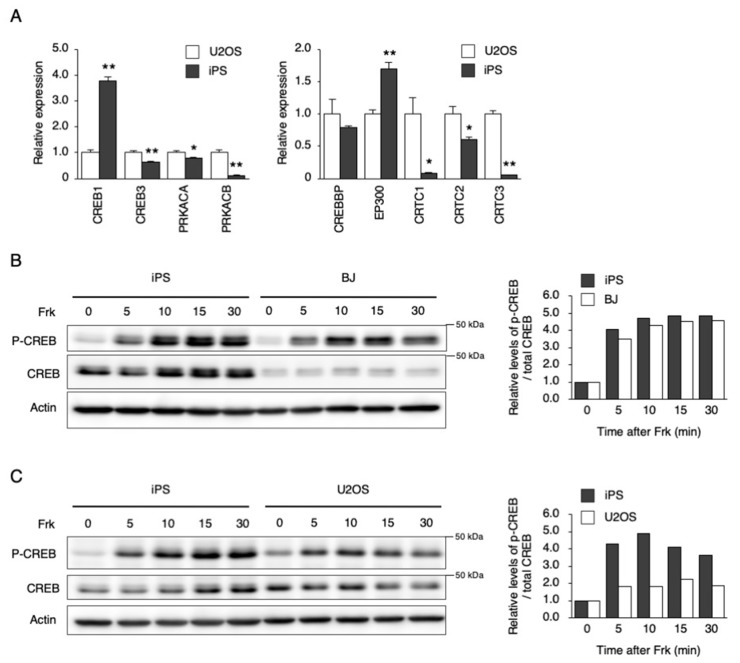
Figure 4.
Response of downstream signaling to Frk stimulation in hiPSCs. (A) The expression levels of genes involved in cAMP signaling in U2OS cells and hiPSCs. Data are presented as the means ± SEM relative to U2OS; n = 4 for each comparison. * p < 0.05, ** p < 0.01 versus the corresponding control. (B) and (C) Phosphorylation of CREB by Frk stimulation in hiPSCs, BJ, and U2OS cells. Right graph shows quantified levels of p-CREB / total CREB from left blots, respectively. Data are presented as the means ± SEM relative to each 0 h.

