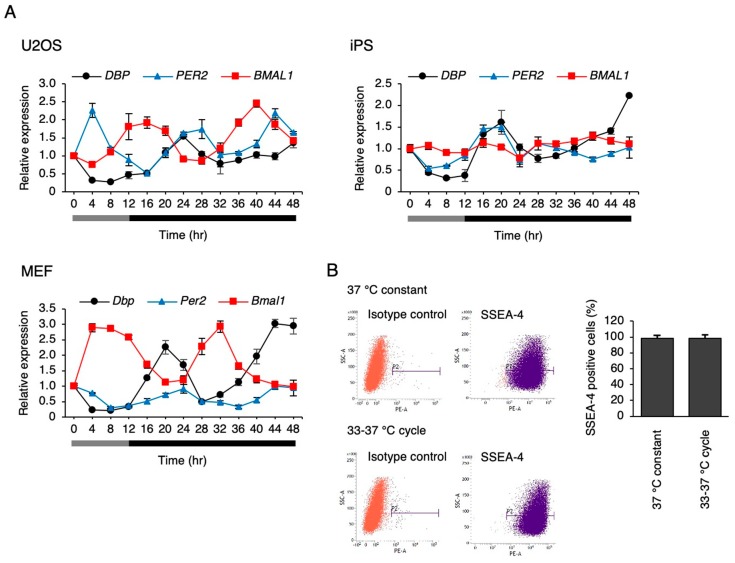
Figure 6.
The response of clock genes to the simulated rhythm of body temperature. (A) The expression levels of clock genes under the temperature rhythm in U2OS cells, hiPSCs, and mouse embryonic fibroblasts (MEFs). 0 h refers to the start of day 5 of the temperature rhythm. The temperature was set at 33 °C from 0 to 12 h (gray bar) and then at 37 °C from 12 to 48 h (black bar). Data are presented as the means ± SEM relative to 0 h. n = 3 for each comparison. P values for the rhythmicity of DBP, PER2, and BMAL1 were determined by a cosinor analysis with p = 0.04, p = 0.12, and p < 0.01 in U2OS cells; p = 0.02, p = 0.35, and p = 0.43 in hiPSCs; and p < 0.01, p < 0.01, and p < 0.01 in MEF. (B) The pluripotency marker SSEA-4-positive cells in hiPSCs after a 6 day culture according to temperature rhythm. P2 indicates the SSEA-4 positive region, and the bar graph shows the percentage of SSEA-4-positive cells. Data are presented as the means ± SEM; n = 4 for each comparison.

