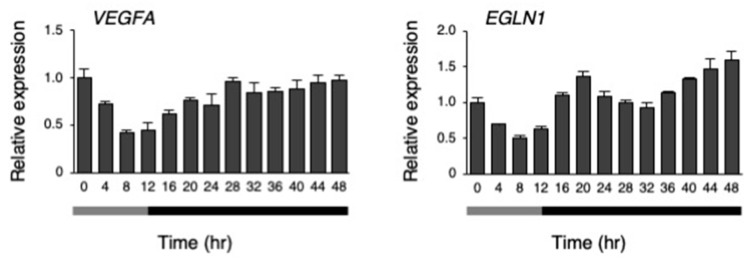
Figure 9.
The response of hypoxia responsive genes to the temperature rhythm. The expression levels of VEGFA and EGLN1 under their temperature rhythms in hiPSCs; 0 h refers to the start of day 5 of the temperature rhythm. The temperature was set at 33 °C from 0 to 12 h (gray bar) and then at 37 °C from 12 to 48 h (black bar). Data are presented as the means ± SEM relative to 0 h; n = 3 for each comparison. The p values for the rhythmicity of VEGFA and EGLN1 were determined by a cosinor analysis with p = 0.18 and p < 0.01, respectively.

