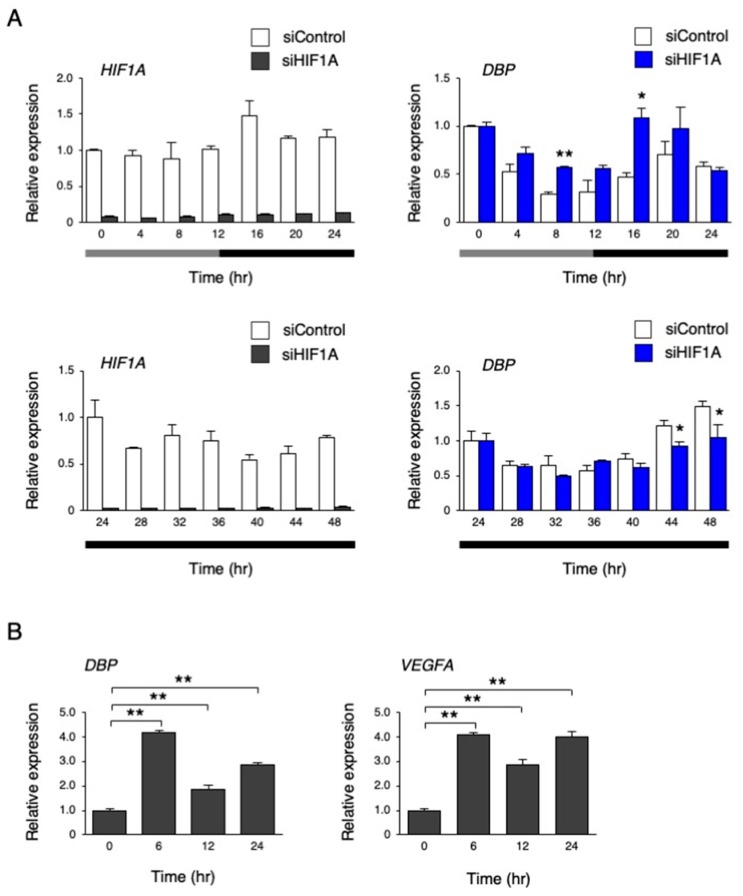
Figure 10.
The effect of inhibiting HIF-1α on the circadian-like rhythm of DBP expression. (A) The expression levels of HIF1A and DBP under the temperature rhythm in hiPSCs treated with siControl or siHIF1A; 0 h refers to the start of day 5 of the temperature rhythm. The temperature was set at 33 °C from 0 to 12 h (gray bar) and then at 37 °C from 12 to 24 h and 24 to 48 h (black bar). Data are presented as the means ± SEM. The left graph shows the relative value to 0 h or 24 h of siControl, and the right graph shows the relative value for 0 h or 24 h, for siControl and the target siRNA; n = 3 for each comparison. A two-way repeated measure ANOVA revealed significant differences between siControl and siHIF1A (0 to 24 h, p < 0.01; 24 to 48 h, p = 0.02). Asterisks show the significant differences at each time point, with * p < 0.05, ** p < 0.01 (Student’s t-test). (B) The expression levels of DBP and VEGFA under a hypoxic condition (1% O2) in hiPSCs. Data are presented as the means ± SEM relative to 0 h; n = 3 for each comparison. ** p < 0.01 versus each value at 0 h.

