Figure 1.
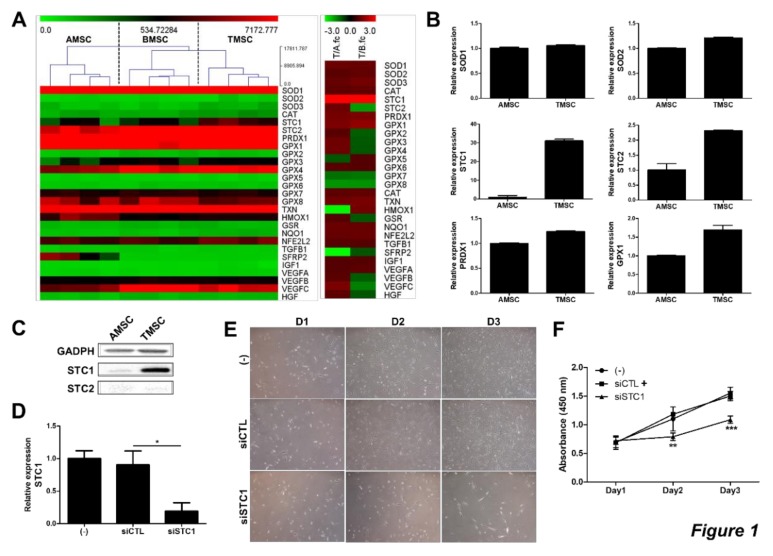
Functional expression of STC1 in TMSCs). Gene expression profiles for ROS-regulating factors were analyzed in TMSCs compared to BMSCs and AMSCs. T/A fc and T/B fc in right panel indicate fold change of TMSC/AMSC and that of TMSC/BMSC, respectively (A). mRNA expressions of pivotal factors for ROS regulation in TMSCs were determined by qPCR compared with those in AMSCs (B). STC1 and 2 expressions in protein level were detected by immunoblotting (C). siRNA for STC1 was transfected in TMSCs and cell viability was measured by MTT assay (D). Photographs of cells were taken at day 1, 2 and 3 after seeding of untreated TMSCs and siCTL- or siSTC1-treated TMSCs (E). Cell viability of siSTC1-treated TMSCs was determined by MTT assay compared to untreated or siCTL-treated TMSCs (F). Results are three technical replicates of TMSC from one donor. Representative results from two different TMSCs with similar tendency were presented. *P< 0.05, **P < 0.01, ***P < 0.001. Results are shown as mean ± SD.

