Figure 5.
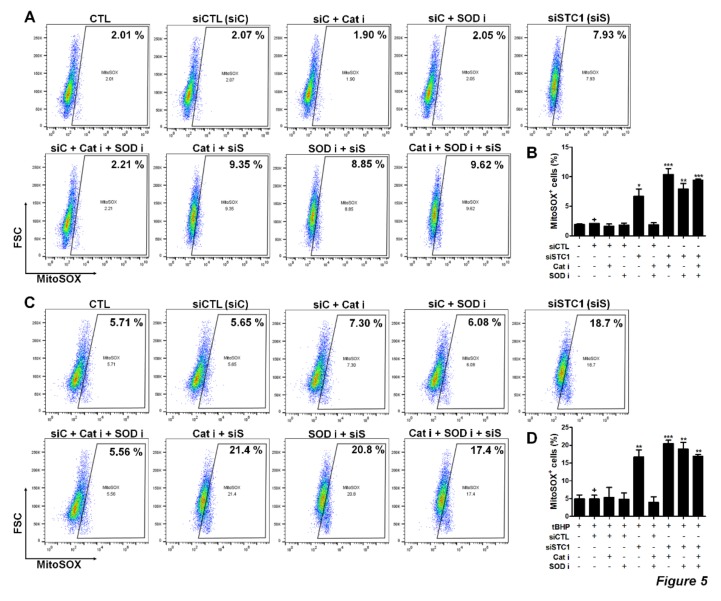
ROS regulation by STC1 in TMSCs. Mitochondrial ROS level in TMSCs after STC1, catalase or superoxide dismutase (SOD) inhibition was measured by staining with mitoSOX. mitoSOX+ cells were determined by flow cytometry (A) and quantified (B). Tert-Butyl hydroperoxide (tBHP) was treated for the induction of ROS generation in TMSCs and mitoSOX+ cells were determined by flow cytometry (C) and quantified (D). Dot plot data are representative results from two different TMSCs with similar tendency. Quantified data are integrated results of two technical replicates of TMSCs from two donors. *P < 0.05, ** P < 0.005, *** P < 0.001. Results are shown as mean ± SD.

