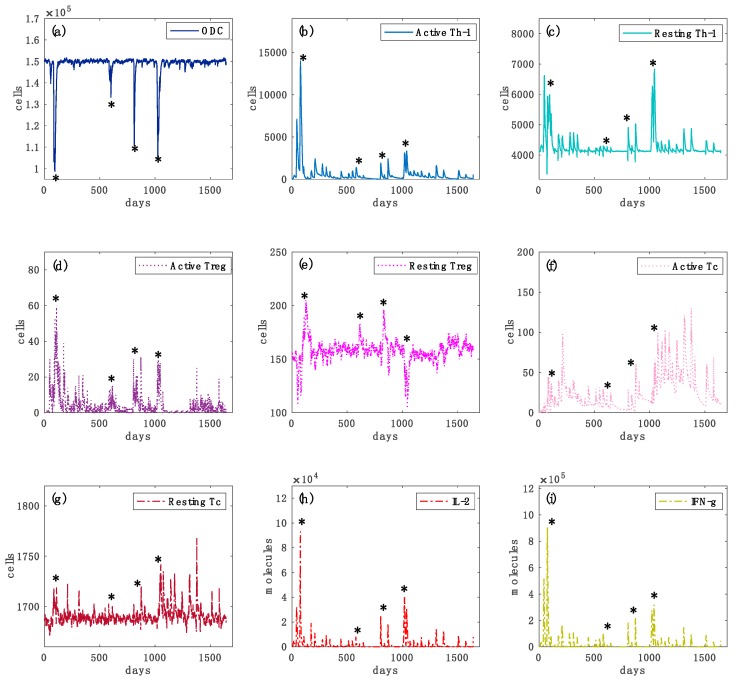
Figure 5.
Simulated oligodendrocyte (ODC), Active T helper cells (Active Th-1), Resting T helper cells (Resting Th-1), Active regulatory T cells (Active Treg), Resting regulatory T cells (Resting Treg), Active cytotoxic T cells (Active Tc), Resting cytotoxic T cells (Resting Tc) populations and inflammatory cytokines Interleukin-2 (IL-2) and Interferon-gamma (IFN-g) dynamics for the virtual healthy control patient are respectively depicted in panels (a–i), respectively. In each panel, star symbols highlight the time-points at which relapses occur, i.e., the time points in which the level of ODC cells goes below the mentioned MRI detectable event threshold. In panel (a), one can notice different loss of oligodendrocytes levels that indicate specific relapse events. In panels (b,c), the levels of active Th-1 cells, which are potentially dangerous in inducing an auto-reactive immune response against oligodendrocytes, are much higher in comparison with the healthy case (Figure 4, panel (a)). It is caused by an impaired regulatory T cells activity. In panels (d,e) the activation of regulatory T cells and their consequent activity in suppressing any auto-reactive immune response is noticeably insufficient. In panels (f,g), active cytotoxic T cells levels are present, indicating a cytotoxic activity directed to oligodendrocytes. In panels (h,i), interleukin 2 (IL-2) and inflammatory interferon gamma (IFN-g) cytokines show sufficient levels to induce a strong inflammatory condition.

