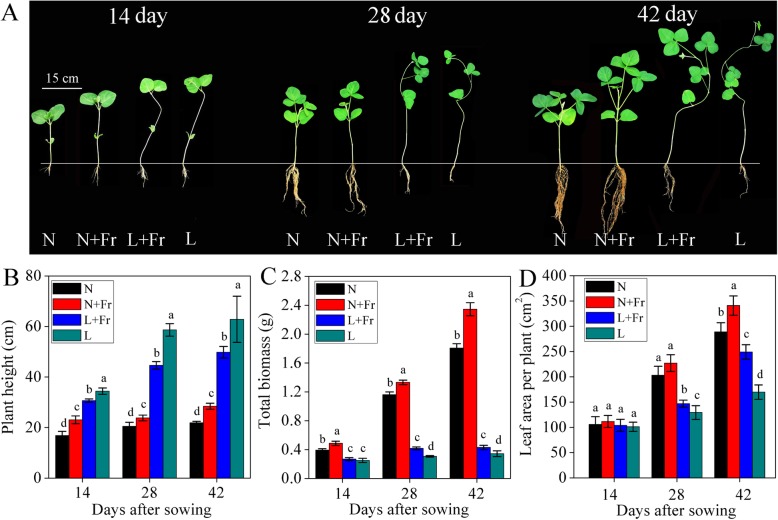
Fig. 1.
Soybean growth performance (a), plant height (b), total biomass (c), and leaf area (d) under different treatments. N, N + Fr, L + Fr, and L denote normal light (normal PAR and normal R/Fr ratio), normal light plus far-red light (normal PAR and low R/Fr ratio), low light plus far-red light (low PAR and low R/Fr ratio), and low light (low PAR and normal R/Fr ratio), respectively. Each value was expressed as the mean ± SD. The means for each treatment without common letters were significantly different at P = 0.05 according to Duncan’s multiple range test

