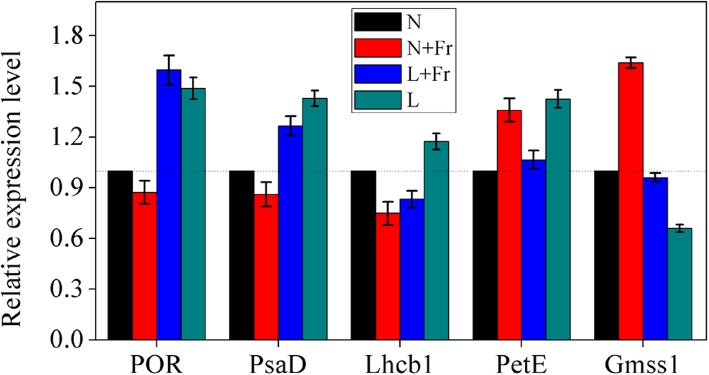
Fig. 6.
Quantitative RT- PCR validations of the genes related to the differentially expressed proteins. N, N + Fr, L + Fr, and L denote normal light (normal PAR and normal R/Fr ratio), normal light plus far-red light (normal PAR and low R/Fr ratio), low light plus far-red light (low PAR and low R/Fr ratio), and low light (low PAR and normal R/Fr ratio), respectively. POR, PsaD, Lhcb 1, and PetE represent protochlorophyllide reductase, photosystem I subunit, chlorophyll a/b binding protein 1, and plastocyanin, respectively. Values are expressed as mean ± SD (n = 3)

