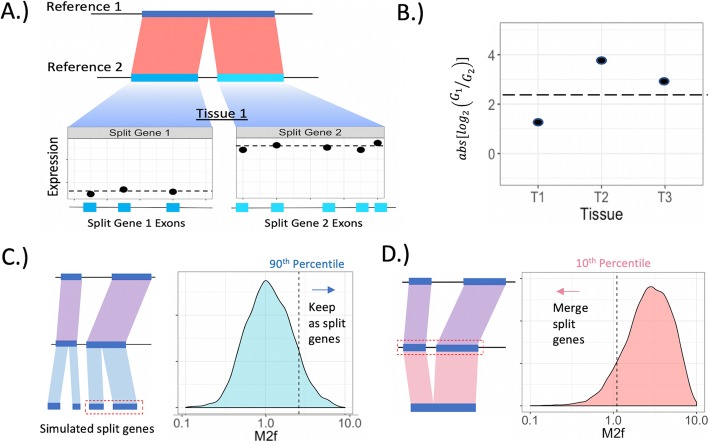
Fig. 2.
M2f approach for determining correct gene model(s) for split-gene candidates. a Calculating average normalized expression across exons within a tissue for a pair of split-gene genes. b M2f calculation. The absolute log2-fold change in average expression (from a) across the split-genes is averaged across tissues. Higher values reflect large expression differences across split-genes. c Simulating the M2f distribution under the null hypothesis that split-gene expression differences come from a single underlying gene. Observed M2f values greater than the 90th percentile of this null distribution are unlikely to result if the single gene annotation is correct. d Simulating the M2f distribution under the null hypothesis that split-gene expression differences come from separate, adjacent genes

