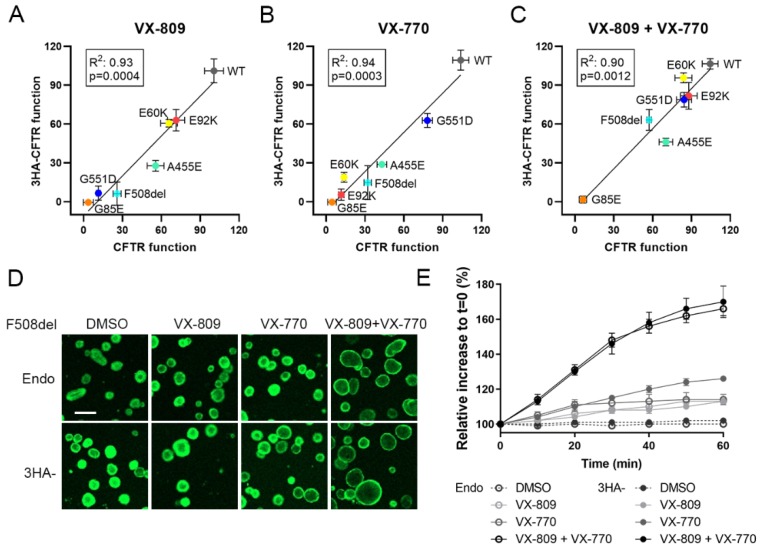
Figure 2.
Study of the effect of tagging CFTR variants on CFTR function. (A–C) Pearson correlation of the rescue in CFTR function by corrector VX-809, potentiator VX-770 or the combination of both, of untagged and 3HA-tagged CFTR variants (for individual quantification, see Figure 3). HEK293T cells stably overexpressing CFTR variants were treated with 2.5 µM VX-809 for 24 h and/or 3 µM VX-770 for 20 min prior to determining CFTR function by HS-YFP quenching after stimulation with 10 µM forskolin (Fsk). Graphs depict the mean ± S.D. of three independent experiments. (D,E) Comparison of FIS responses of treated organoids with VX-809 (24 h, 2.5 µM), VX-770 (3 µM), VX-809+VX-770 or DMSO, all together with Fsk 5 µM. (D) Representative images of a FIS response for F508del/F508del CF organoids (top row, ‘Endo’; expressing endogenous F508del) and for CF organoids (genotype N1303K/3121-1G > A) stably overexpressing 3HA-F508del by LV transduction (bottom row, ‘3HA-‘), treated with DMSO, VX-809, VX-770 or both. Images represent t = 60 min after Fsk addition. Live organoids were visualized with calcein green. Scale bar = 200 µm. (E) Time course of both conditions over 60 min and responses to above CFTR modulators. A representative experiment is shown (n = 2 independent repeats). Mean ± S.D. of 4 wells per condition (~300 organoids/well). HS-YFP: halide sensitive yellow fluorescent protein, FIS: forskolin induced swelling, LV: lentiviral vector.

