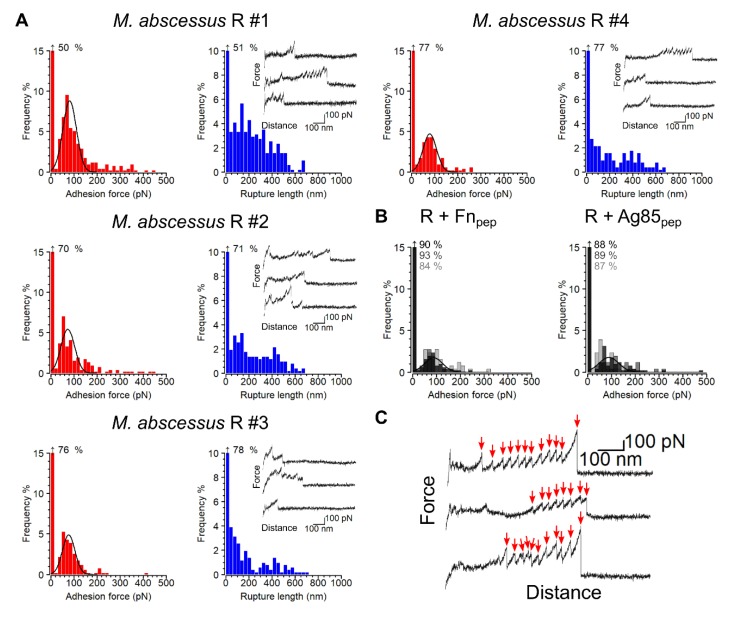
Figure 2.
Force interactions between single M. abscessus R cells and Fn. (A) Adhesion force (left) and rupture length (right) histograms obtained for four M. abscessus R cells. An inset in the rupture length histograms shows three representative force-distance curves originating from the same dataset. (B) Injection of Fnpep (left) or Ag85pep (right) both resulted in significant decreases in Ag85-Fn binding frequency. Shown are overlays of three adhesion force histogram plots obtained for three different cells. (C) Representative force-distance curves showing sawtooth patterns of successive unbinding events, the peaks being separated by approximately 28 nm (red arrows).

