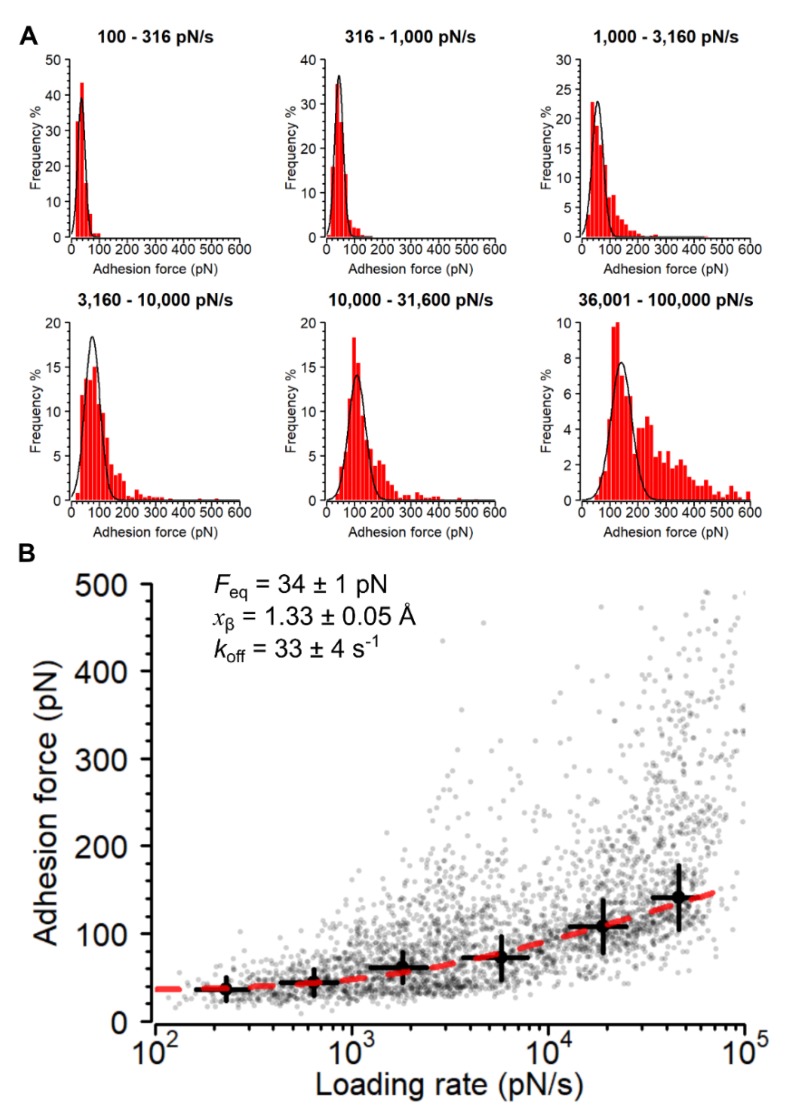
Figure 4.
Mechanical stress strengthens the Ag85-Fn interaction. (A) Adhesion force histogram plots at different loading rates (n = 3,188 curves from 13 cells). The Gaussian distributions represent rupture events for single bonds. (B) Dynamic force spectroscopy plot showing Ag85-Fn binding force activation under mechanical stress. Large circles and error bars represent means and standard deviations calculated for the first Gaussian distributions at each loading rate as shown in panel A. The dashed red line represents the fit of the Friddle–Noy–de Yoreo model to the pooled data from the Gaussian bins in panel A (n = 2420 data points).

