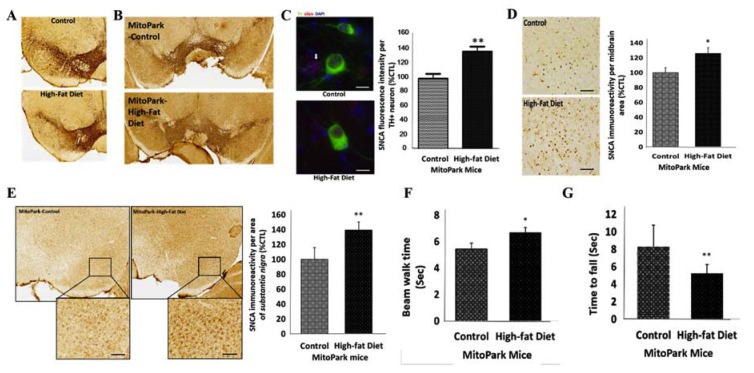
Figure 2.
Diabetes contributes to the progression of PD by amplifying the loss of tyrosine hydroxylase (TH)+ dopaminergic neurons and enhancing α-synuclein (SNCA) expression, in vivo. (A) Representative IHC images of TH immunoreactivity in the midbrain substantia nigra of high-fat diet-induced diabetes C57BL/6 mice compared to the control mice. (B) Representative IHC images of SNCA immunostaining in the substantia nigra of diabetic MitoPark mice, compared to their control non-diabetic counterparts. (C) Representative immunofluorescence images of α-syn/SNCA (red) and TH (green) expression in the midbrain of control and diabetic MitoPark mice, captured by deconvolution microscopy. 4′,6′-diamidino-2-phenylindole (DAPI) serve as nuclear staining (left). Graphical representation of the SNCA fluorescence intensity in TH-positive dopaminergic (DA) neurons from diabetic MitoPark mice (control: 100 ± 6.6%, diabetic: 137.7 ± 8.2%, nTH + neurons = 24, p < 0.01) (right). (D) Representative images (left) and graphical representation (right) of SNCA immunoreactivity in the midbrain tectum of control and high-fat diet-induced diabetes MitoPark mice (control: 100 ± 8.7%, diabetic: 126 ± 7.6%, n = 3). (E) Representative IHC images (left) and graphical representation (right) of SNCA expression in the substantia nigra of control and high-fat diet-induced diabetes MitoPark mice (control: 100 ± 15.7%, diabetic: 139.2 ± 10.9%, n = 3). *, p < 0.05, **, p < 0.01; control, non-diabetic mice. (F) Diabetic MitoPark mice took a longer time to walk the beam compared with control MitoPark mice (control: 5.43 ± 0.46, diabetic: 6.67 ± 0.39 s, n = 3). (G) Diabetic MitoPark mice stayed a shorter length of time on the rotarod tests (control: 8.3 ± 2.5, diabetic: 5.3 ± 1 s, n = 3).

