Figure 1.
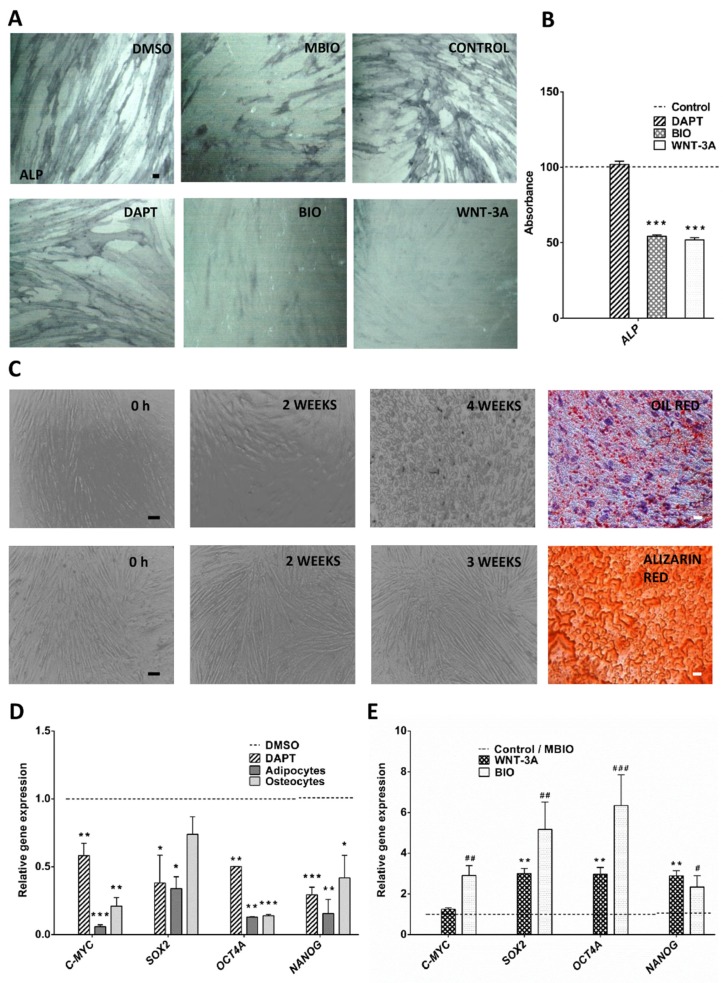
Notch and Wnt signaling regulate cell differentiation and pluripotency core factor expression in DPSCs (A): ALP activity assay showed that Wnt activation suppressed the default osteoblastic pre-commitment in DPSCs. Scale bar = 100 µm. (B): Quantification of ALP absorbance in DPSC cultures after WNT-3A/BIO application (C): DPSC differentiation to adipocytes and osteocytes. Phase-Contrast (PC) Microscopy and Alizarin S Red and Oil Red staining showed a phenotypic change and terminal differentiation of control DPSCs after adipoinduction and osteoinduction treatments. Top panel: terminal adipocyte differentiation was assessed by Oil Red (bright red spots) staining after 4 weeks, cell nuclei are counterstained with Hematoxylin; bottom panel: terminal osteoblastic differentiation was assessed by Alizarin Red staining after 3 weeks. Scale bar = 100 µm (Alizarin, Oil Red). Scale bar = 20 µm (PC) (D): Q-PCR transcript expression analysis for core pluripotency factors C-MYC, SOX2, OCT4A and NANOG between control and terminally differentiated DPSC cultures, and also between control and DAPT-treated DPSCs (E): Q-PCR analysis of core factors in DPSC cultures after BIO/WNT-3A application, with respect to their respective controls MBIO/PBS (dashed line). Data are normalized to reference β-ACTIN and GAPDH levels and presented as the mean+SEM (n = 3). *: p < 0.05; **: p < 0.01; ***: p < 0.001. Dunn’s Test, Kruskal- Wallis H Test. Asterisks (*) report significance with respect to controls PBS/DMSO, and Hash symbol (#) represents significance with respect to control MBIO. #: p < 0.05; ##: p < 0.01; ###: p < 0.001.

