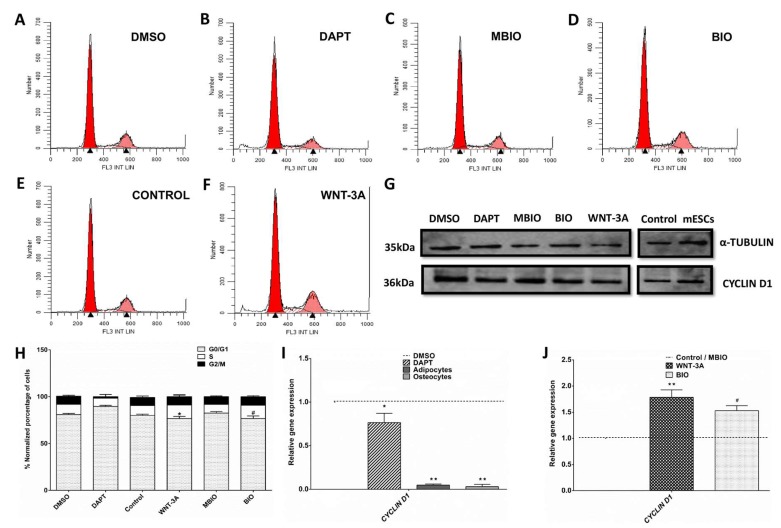
Figure 2.
Notch/Wnt treatment effect over cell cycle in DPSCs. (A–F): Flow cytometry analysis of DPSC cultures exposed to different conditions for 48 h (DMSO, DAPT, MBIO, BIO, WNT-3A). Control (E) represents DPSCs grown in standard medium. (G): Western Blot showing CYCLIN D1 protein expression in the different conditions. (H): Representation of the percentage of cells in the different cell cycle phases (G0/G1, S, G2/M) under each condition. Data are presented as the mean+SEM (n = 8). (I) Q-PCR analysis of CYCLIN D1 transcript expression in DPSCs exposed to DAPT or terminal adipogenic and osteogenic cell differentiation treatments, with respect to controls (dashed line). (J) Q-PCR analysis of CYCLIN D1 transcript expression in BIO and WNT-3A-treated DPSCs with respect to their respective controls MBIO/PBS (dashed line). Data are normalized to reference β-ACTIN and GAPDH levels and presented as the mean + SEM (n = 3). *: p < 0.05; **: p < 0.01; ***: p < 0.001. Dunn’s Test, Kruskal- Wallis H Test. Asterisks (*) report significance with respect to controls PBS/DMSO, and Hash symbol (#) represents significance with respect to control MBIO.

