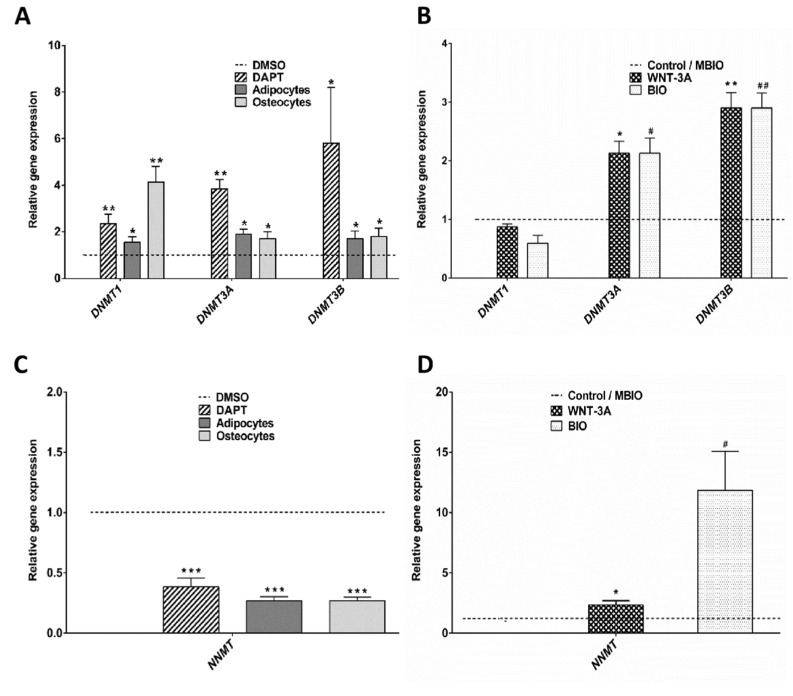
Figure 4.
Notch and Wnt signaling affect the expression of methyltransferases in DPSCs. (A,B): Q-PCR showing relative differences in DNA-methyltransferases DNMT1, DNMT3A and DNMT3B expression in DPSCs between control (DMSO, MBIO) and DAPT, BIO, WNT-3A, adipoinduction and osteoinduction conditions. Data are normalized to reference β-ACTIN and GAPDH levels and represented as the mean + SEM (n = 3). (C,D): Q-PCR analysis showing relative differences in transcript expression for the Nicotinamide-N-methyltransferase NMMT in DPSCs subjected to different treatments. Data are normalized to reference β-ACTIN and GAPDH levels and represented as the mean+SEM (n = 3) *: p < 0.05; **: p < 0.01; ***: p < 0.001. Dunn’s Test, Kruskal- Wallis H Test. Asterisks (*) report significance with respect to controls PBS/DMSO, and Hash symbol (#) represents significance with respect to control MBIO. #: p < 0.05; ##: p < 0.01.

