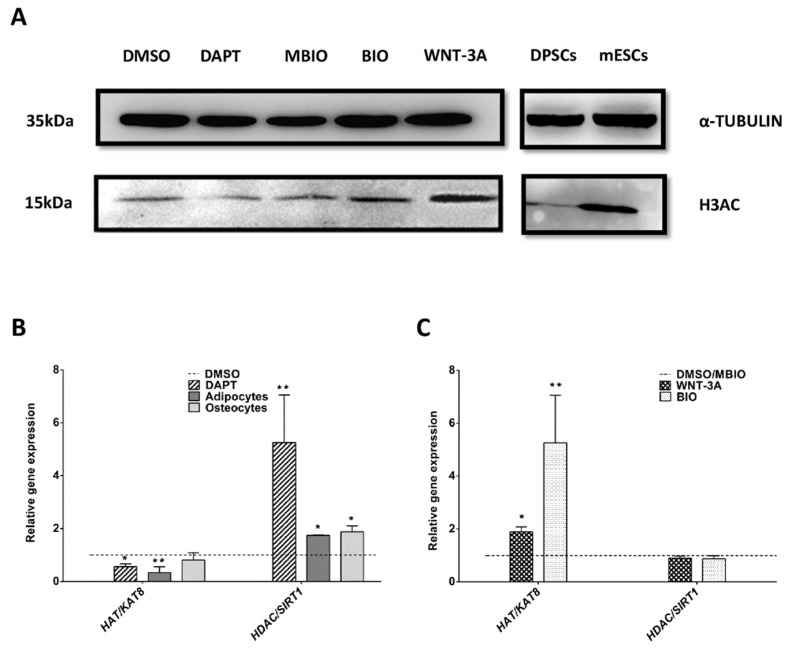
Figure 5.
Notch and Wnt signaling affect histone acetylation in DPSCs. (A): Representative WB showing H3AC levels in control and treated DPSCs. α-TUBULIN was used as a protein loading control. Mouse ESCs were used as a positive control for high levels of H3 acetylation (right panel). Control on right panel shows untreated DPSCs grown in standard conditions. (B): Q-PCR analysis of HAT/KAT8 and HDAC/SIRT1 expression in DAPT-treated and osteo/adipoinduced DPSC cultures. (C): Q-PCR analysis of WNT-3A/BIO treated DPSC cultures for HAT/KAT8 and HDAC/SIRT1. Data are normalized to reference β-ACTIN and GAPDH levels and presented as the mean + SEM (n = 3). *: p < 0.05; **: p < 0.01. Dunn’s Test, Kruskal- Wallis H Test. Asterisks (*) report significance with respect to controls PBS/DMSO, and Hash symbol (#) represents significance with respect to control MBIO.

