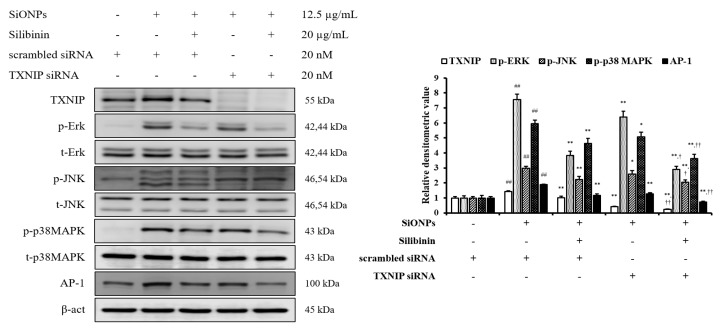
Figure 3.
Effects of TXNIP in the effects of silibinin on SiONPs-induced NCI-H292 cells. Protein expression was determined by Western blotting analysis, and its densitometric value was assessed. Data are shown as means ± SD (n = 3). ## p < 0.01 vs. non-SiONPs-induced NCI-H292 cells, *,** p < 0.05 and < 0.01 vs. SiONPs-induced NCI-H292 cells, respectively, †,†† p < 0.05 and < 0.01 vs. silibinin-treated NCI-H292 cells induced by SiONPs, respectively.

