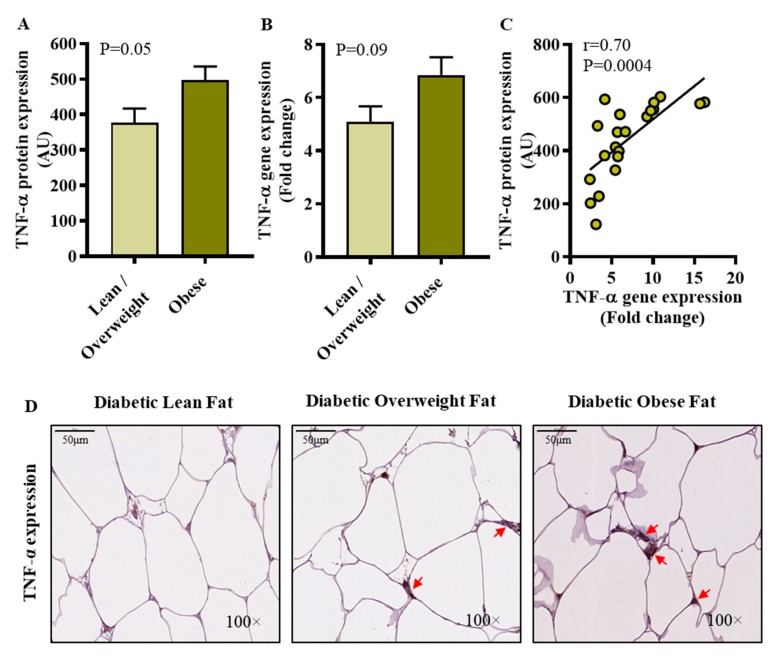
Figure 3.
Elevated adipose TNF-α protein expression in diabetic obese patients. Adipose TNF-α protein and gene expressions were assessed by immunohistochemistry (IHC) and qRT-PCR in 21 and 46 type-2 diabetic patients, respectively, as described in materials and methods. Regarding IHC, TNF-α protein staining intensity expressed as arbitrary units (AU) was determined by using Aperio-positive pixel count algorithm and ImageScope software. The number of positive pixels was normalized to total pixels (positive and negative) and color/intensity thresholds were set with immunostaining as positive and background as negative pixels. Regarding qRT-PCR, GAPDH gene expression was used as internal control. The expression level of TNF-α gene relative to control (lean adipose tissue) was calculated by using 2−ΔΔCt method and expressed as relative mRNA expression or fold change over the average control expression taken as 1. (A) The data (mean±SEM) show that adipose TNF-α protein expression (AU) was significantly higher in diabetic obese compared to diabetic lean/overweight patients (p = 0.05); (B) However, TNF-α transcripts’ expression (fold change) differed non-significantly between diabetic obese and diabetic lean/overweight patients (p = 0.09). (C) A positive association was found between TNF-α gene and protein expression (r = 0.70, p = 0.0004). (D) The representative IHC images from three independent determinations with similar results show the comparative TNF-α protein expression (arrows) in the fat tissue from diabetic lean, overweight, and obese patients (100× magnification; scale bar 50 μm).

