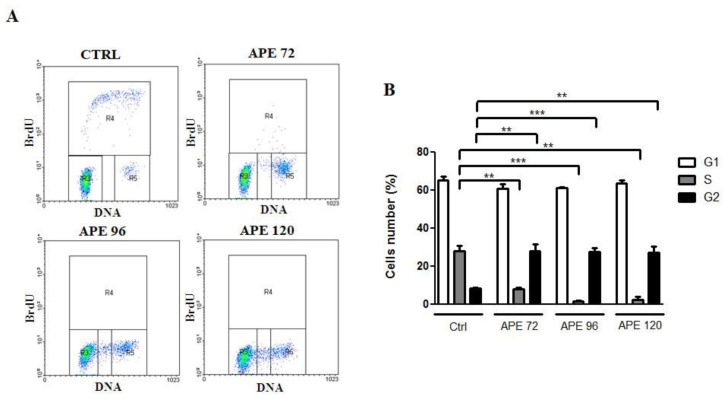
Figure 3.
(A) Bivariate analysis of BrdUrd incorporation and DNA content in GB7 cells at 72, 96 and 120 h after 100 μM APE treatment. (B) Percentage of GB7 cells in G1, S, and G2/M phases after 100 μM APE treatment. (t-test; **p < 0.01; ***p < 0.001). The data are the average ±SEM of three independent experiments.

