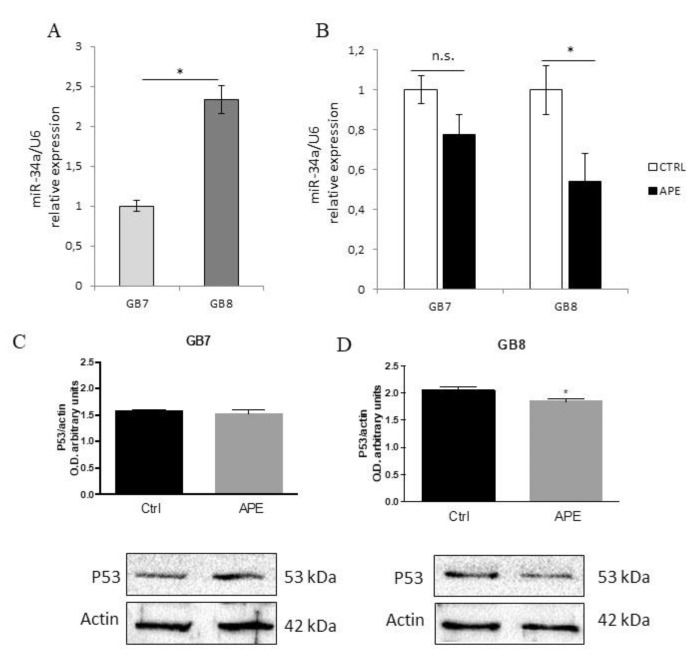
Figure 10.
qRT-PCR analysis for miR-34a-5p expression in GB7 and GB8 cells. (A) miR-34a-5p levels in untreated GB7 or GB8 cultures. MiRNA relative expression in GB7 was set as one and snRNA U6 used as an internal standard. Data are expressed as the average ±SEM. (N = 3, * p ≤ 0.05, t-test). (B) miR-34a-5p levels in untreated (CTRL) or APE-treated (100 μM for 24 h) GB7 or GB8 cells. For each cell line, miRNA relative expression in CTRL samples was set as one and snRNA U6 used as an internal standard. Data are expressed as the average ±SEM. (N = 3, * p ≤ 0.05, t-test). Western blot analysis of p53 expression in GB7 (C) and GB8 (D) cells in absence (ctrl) and presence of 100 µM APE (48 h). The graphs above report the densitometric analysis of the p53 immunoreactive bands normalized with the bands of the reference protein β-actin. The data are the average ±SEM of three independent experiments (t-test; * p < 0.05).

