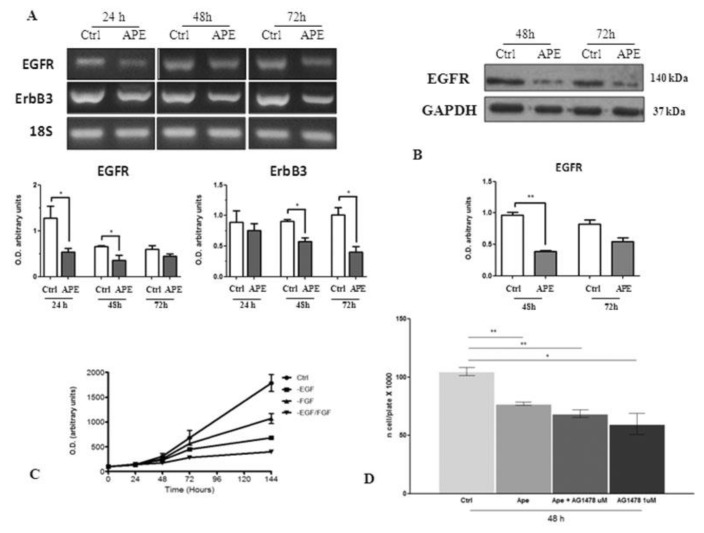
Figure 11.
(A) RT-PCR analysis of EGFR and ErbB3 receptors in GB7 cells. 18 S was used as a housekeeping gene. The graphs below show the densitometric analysis of the bands of RT-PCR indicated in Fig. A normalized with the bands of housekeeping gene 18 S. The data are the average ±SEM of three independent experiments (* p < 0.05 t-test). (B) EGFR expression by Western blot analysis on GB7 cells. GAPDH was used as an internal reference protein. The graph below shows the densitometric analysis of the bands of Western blot analysis for EGFR normalized with the bands of the reference protein GAPDH. The data are the average ±SEM of three independent experiments (** p < 0.01 t-test). (C) MTT assay performed on GB7 cells maintained in complete culture medium containing EGF and FGF (ctrl) either in the absence of FGF, or of EGF, or in absence of both growth factors. (D) MTT assay performed after 48 h of treatment with 100 μM APE or 1 μM of TKI AG1478 inhibitor (t-test; * p < 0.05; ** p < 0.01). The data are the average ±SEM of three independent experiments performed in triplicate.

