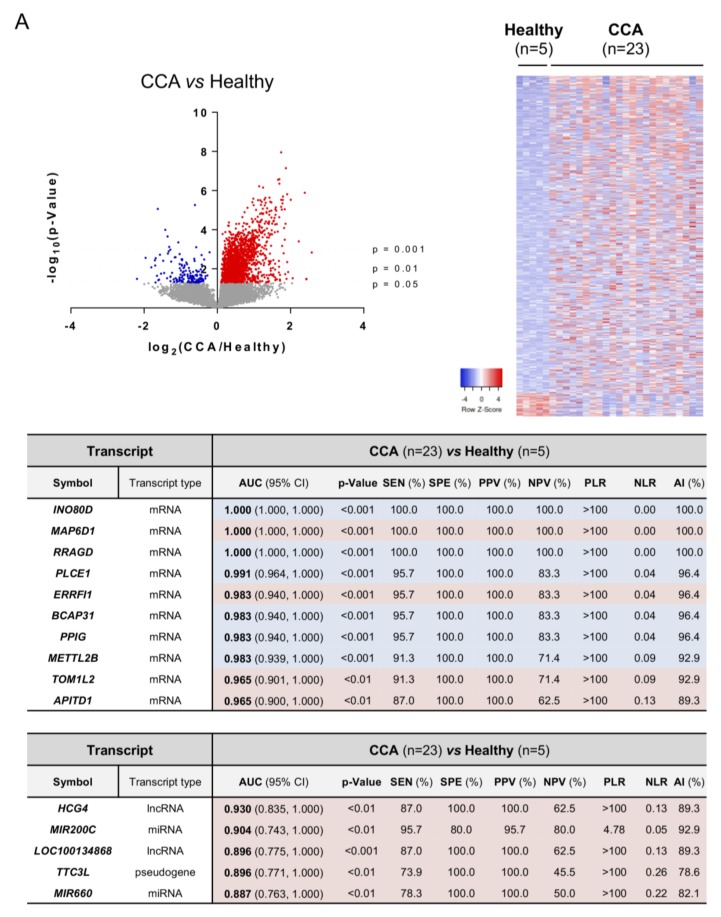
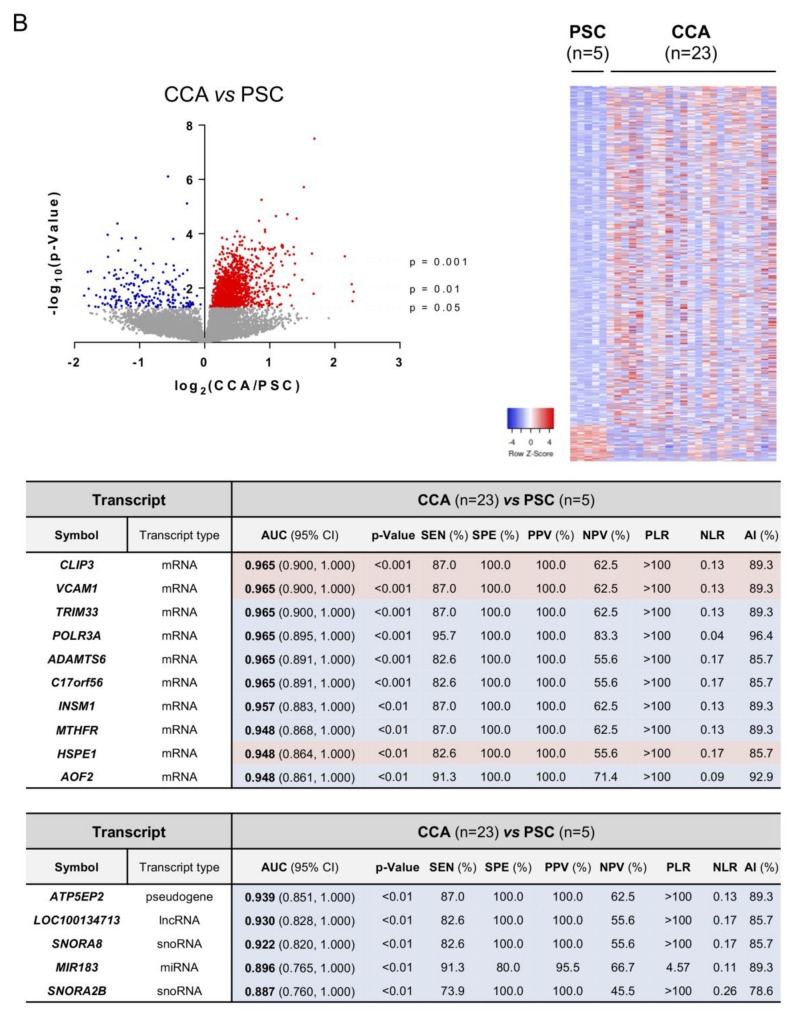
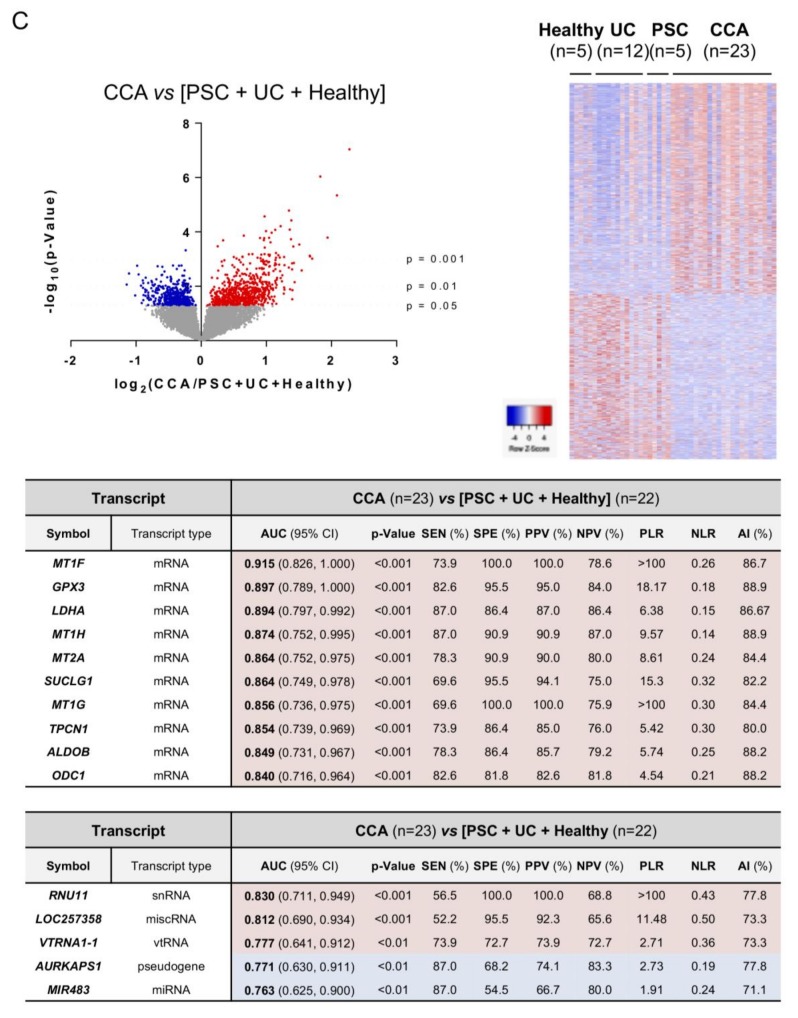
Figure 7.
Differential transcriptomic profile of urine EVs and diagnostic capacity. Volcano plot (−log10(p-value) and log2(fold-change); up left), heatmap of the differentially expressed transcripts (up right) and diagrams with the diagnostic capacity with the highest AUC values of the 10 selected mRNAs and 5 selected non-coding RNAs in serum EVs from (A) CCA vs. Healthy individuals; (B) CCA vs. PSC; (C) CCA vs. (PSC + UC + Healthy individuals). Abbreviations: AI, accuracy index; AUC, area under the receiver operating characteristic curve; CI, confidence interval; miRNA, microRNA; lncRNA, long non-coding RNA; miscRNA, miscellaneous RNA; NLR, negative likelihood ratio; NPV, negative predictive value; PLR, positive likelihood ratio; PPV, positive predictive value; SEN, sensitivity; snRNA, small nuclear RNA; snoRNA, small nucleolar RNA; SPE, specificity; vtRNA, vault RNA.


