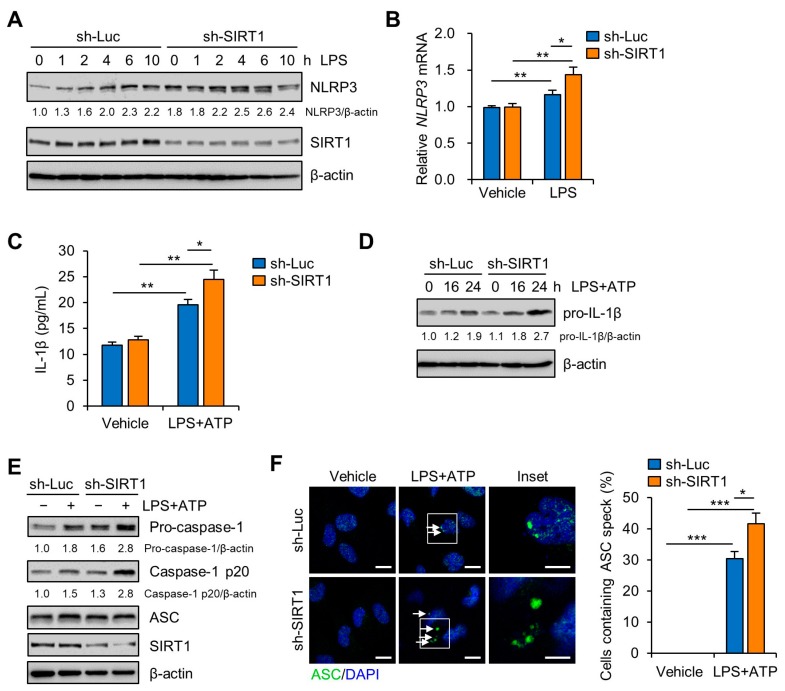
Figure 3.
SIRT1 knockdown enhances LPS-induced NLRP3 inflammasome activation in trophoblasts. (A) Sw.71 cells were infected with lentiviruses expressing shRNAs targeting luciferase (sh-Luc) or SIRT1 (sh-SIRT1) and then treated with LPS (200 ng/mL) for the indicated time. Cell lysates were immunoblotted with anti-NLRP3 and anti-SIRT1 antibodies. (B) Relative mRNA expression of NLRP3 in Sw.71 cells infected with sh-Luc or sh-SIRT1 lentivirus and treated LPS (200 ng/mL) for 12 h. (C) Conditioned media were collected from Sw.71 cells infected with sh-Luc or sh-SIRT1 lentivirus and then treated or not (vehicle) with LPS (200 ng/mL) for 24 h, followed by ATP (5 mM) treatment for 45 min. Levels of IL-1β in the conditioned media were quantified by ELISA. (D) Sw.71 cells were infected with sh-Luc or sh-SIRT1 lentivirus and then treated or not (vehicle) with LPS (200 ng/mL) for the indicated time, followed by ATP (5 mM) treatment for 45 min. Cell lysates were immunoblotted with anti-IL-1β antibody. (E,F) Sw.71 cells were treated with LPS (100 ng/mL) for 24 h and then followed by ATP (5 mM) treatment for 45 min, or were treated with vehicle. (E) Cell lysates were immunoblotted with anti-caspase-1, anti-ASC, and anti-SIRT1 antibodies. (F) Immunofluorescence staining of ASC (green). The white arrow represents ASC specks. Nuclei were stained with DAPI (blue). Scale bars, 20 μm; inset, 10 μm. Endogenous ASC specks were quantified. β-Actin served as a loading control. Numbers below the immunoblot bands indicate the fold changes normalized to the control bands. Data are shown as mean ± S.E.M. Results are representative of at least three independent experiments. * p < 0.05; ** p < 0.01; *** p < 0.001 (Student’s t-test).

