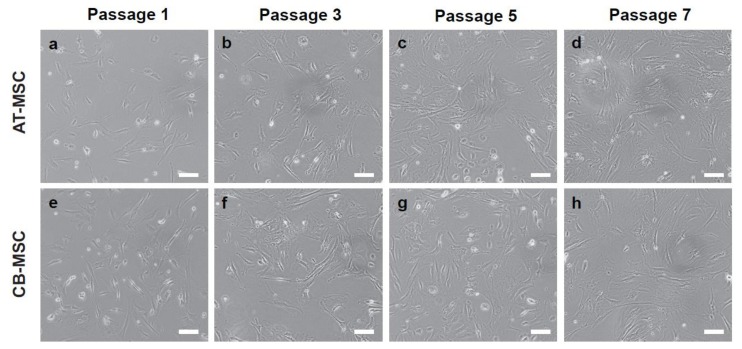
Figure 1.
Cell morphology of AT-MSC and CB-MSC. Morphologies of MSCs at (a,e) passage 1, (b,f) passage 3, (c,g) passage 5, and (d,h) passage 7 were shown. Cell morphology changed gradually from spindle-like to flat and fibroblastoid with increasing passage number. Representative images were taken at 20× magnification. Scale bars: 100 µm.

