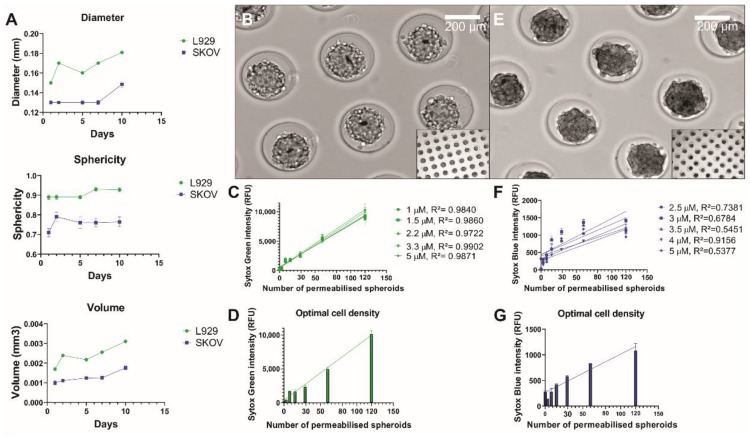
Figure 2.
Characterization of the spheroids and analysis of linear correlation between Sytox intensity and cell density. (A) Diameter, sphericity and volume of L929 and SKOV spheroids. (B) Brightfield image of day 1 L929 spheroids showing globular spheroids that are not yet fully compacted. (C) Sytox Green intensity for different concentrations of Sytox Green was plotted out against different spheroid densities. Linear correlation was measured as R2 and the highest correlation was found for Sytox Green 3.3 µM. (D) The increase of Sytox intensity for Sytox Green 3.3 µM is shown. Starting from 30 spheroids, a high increase in intensity was found until 120 spheroids. (E) Brightfield image of day 1 SKOV spheroids showing irregularly shaped spheroids that are quite compact. (F) Sytox Blue intensity for different concentrations of Sytox Blue was plotted out against different spheroid densities. Linear correlation was measured as R2 and the highest correlation was found for Sytox Blue 4 µM. (G) The increase of Sytox intensity for Sytox Blue 4 µM is shown. Starting from 30 spheroids, a high increase in intensity was found until 120 spheroids.

