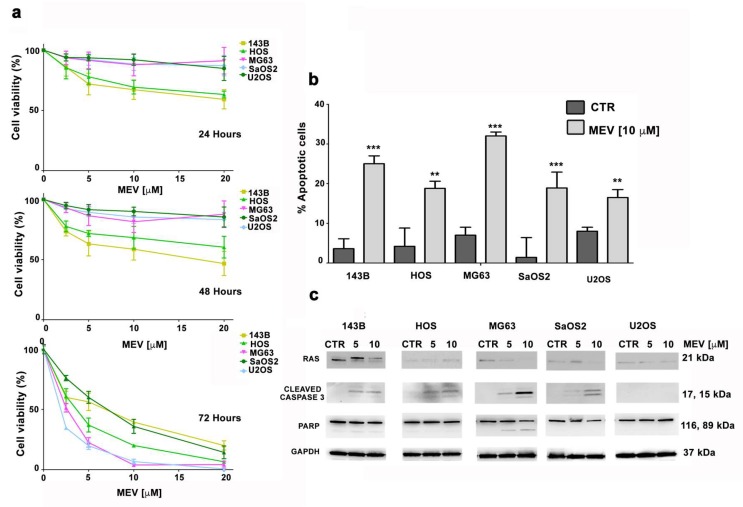
Figure 5.
(a) MTT assays were performed at 24, 48, and 72 h after treatment with increasing concentrations of mevinolin. At least three independent experiments were performed. (b) OS cells were treated with 10 μM of mevinolin for 48 h and an Annexin V-FITC/PI staining assay was performed. The mean ± SD of three separate experiments is shown. CTR: untreated cells. Asterisks indicate statistically significant differences versus untreated (CTR) cells, **p < 0.01, ***p < 0.001. (c) Western blotting analysis of OS cell lines treated with mevinolin (5–10 µM) for 48 h.

