Figure 7.
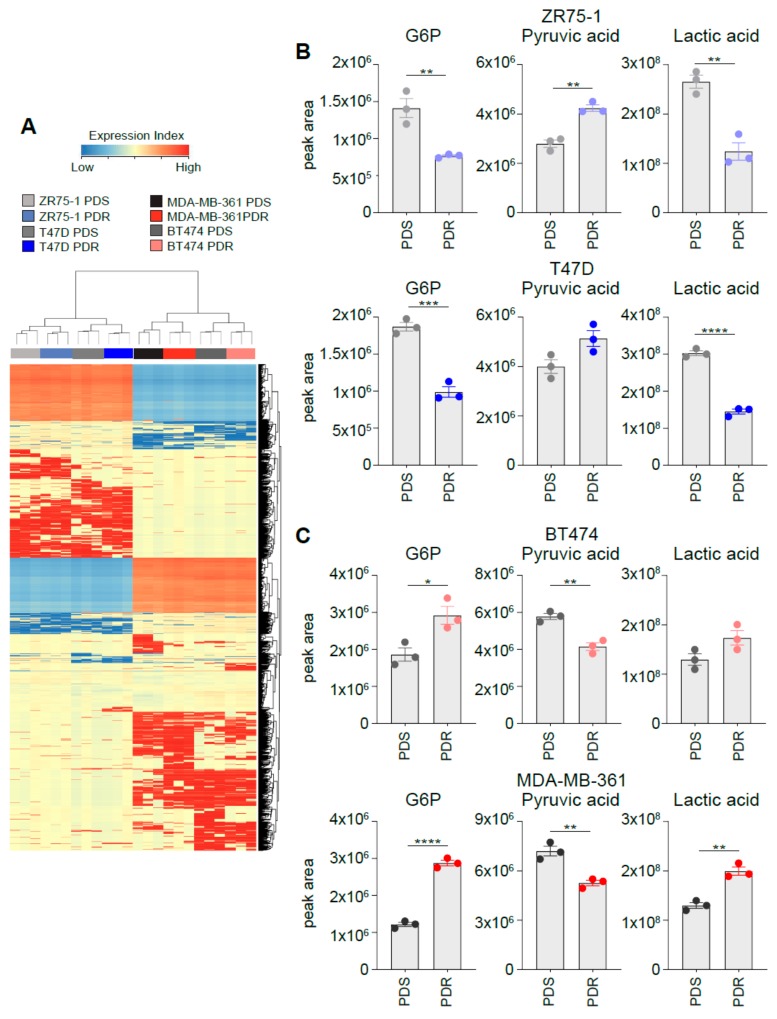
Metabolomic profiling identifies a distinct intracellular metabolites pattern between HER2+ and HER2− ER+ PDR cells. (A) Unsupervised hierarchical clustering and heat map of the entities derived by the cell lysis, metabolites extraction, and subsequent derivatization before processing to gas chromatography–mass spectrometry (GC–MS) from three independent biological replicates of PDS and PDR cell lines. (B, C) Intracellular relative abundance of the following metabolites in ER+/HER2− (B) and in ER+/HER2+ cells (C): glucose-6-phosphate, lactate and pyruvate. * p < 0.05; ** p < 0.01; *** p < 0.001; **** p < 0.0001.

