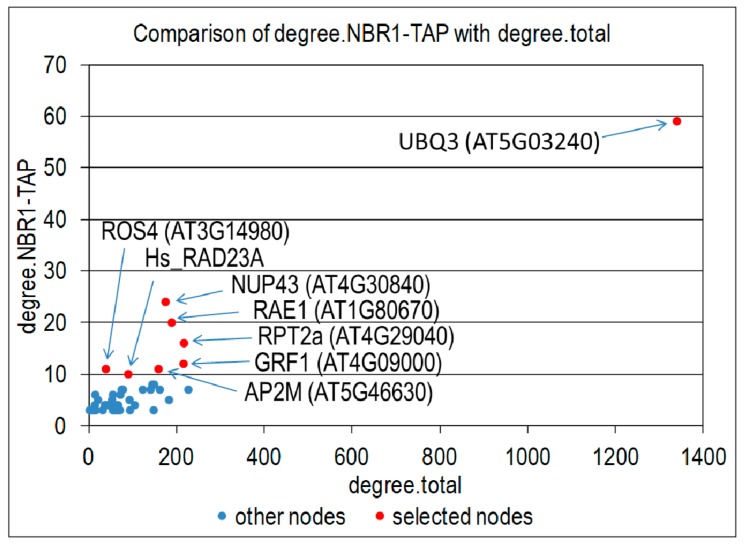
Figure 7.
Identification of proteomic hubs. Number of proteins co-purifying with NBR1-TAP (degree. NBR1-TAP) is plotted against the total number of proteins having known interactions with a given network node (degree.total). All network nodes with degree. NBR1-TAP equal 3 or higher are shown as blue dots. All nodes with degree. NBR1-TAP equal 10 or higher were selected as most significant and are shown as red dots, indicated by arrows and labeled.

