Figure 1.
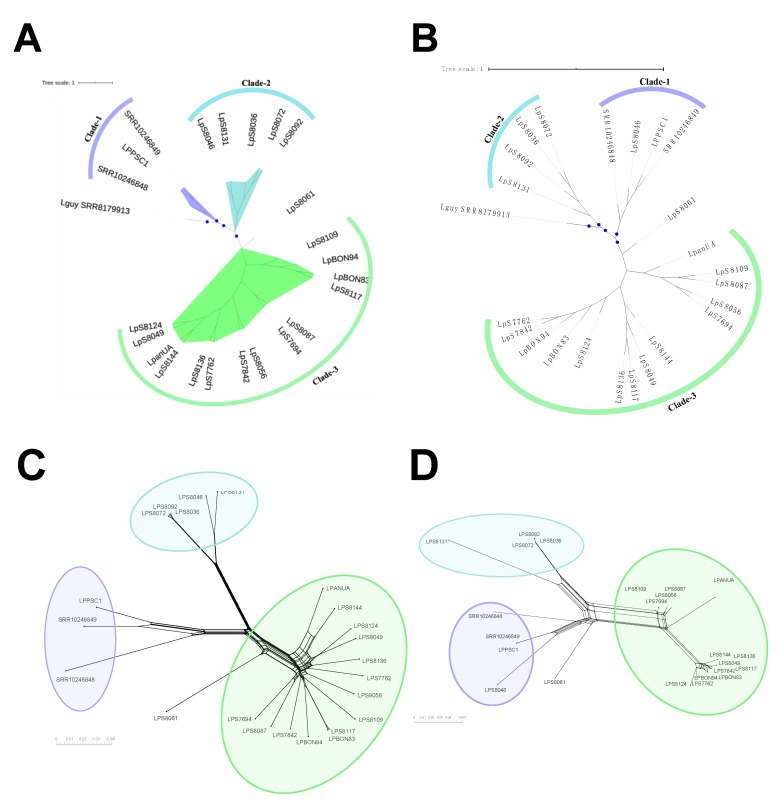
Leishmania panamensis phylogenomic relationships of nuclear and mitochondrial genomes. The trees located in the top of the figure represent the phylogenomic analysis based on nuclear (A) and mitochondrial: Maxicircle (B) single-nucleotide polymorphism (SNP) alignments of 22 genome sequences analyzed in this study, which were built under a Bayesian approach conducted in BEAST-2 program and using Lguy_SRR8179913 (L. guyanensis) as outgroup. LpanUA was used as a reference genome of L. panamensis. The posterior probabilities ≥ 0.8 are indicated by blue circles. The bottom panel represents the phylogenetic network (NeighborNet) constructed in SplitsTree 5, based on nuclear (C) and mitochondrial: Maxicircle (D) SNPs alignments for the 22 genomes analyzed.

