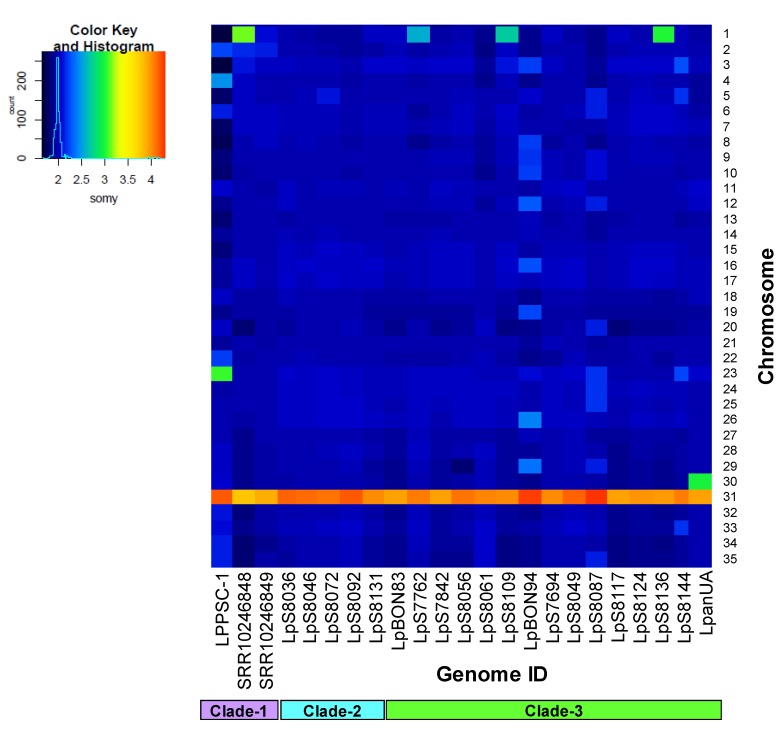
Figure 2.
Dynamics of somy among the genomes of Leishmania panamensis analyzed. The heatmaps show median normalized read depths of 35 chromosomes (y-axis) identified in each genome of L. panamensis (x-axis) The color key indicates the somy value (S), which ranged from 1 to 5 as follows: monosomy, S < 1.5; disomy, 1.5 ≤ S < 2.5; trisomy, 2.5 ≤ S < 3.5; tetrasomy, 3.5 ≤ S < 4.5; and pentasomy, 4.5 ≤ S < 5.

