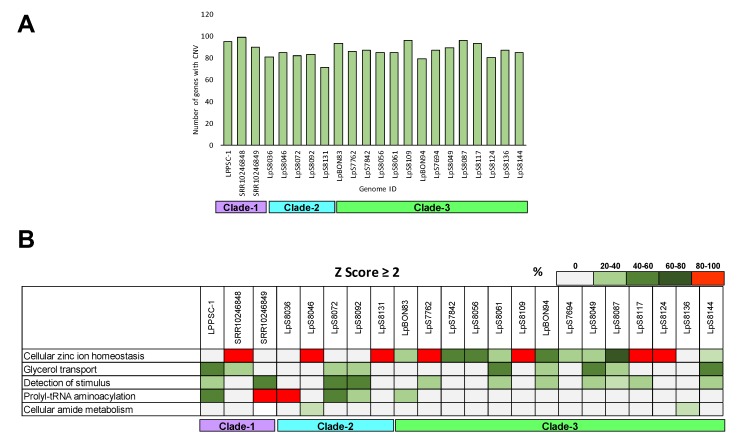
Figure 3.
Evaluation of copy number variation (CNV) genes and ontology enrichment analyses. The figure shows the number of genes with CNVs in each genome analyzed (A) and the ontology enrichment analyses in the genes that present CNVs per sample (B). The color describes the percent of genes associated with each biological process per genome analyzed.

