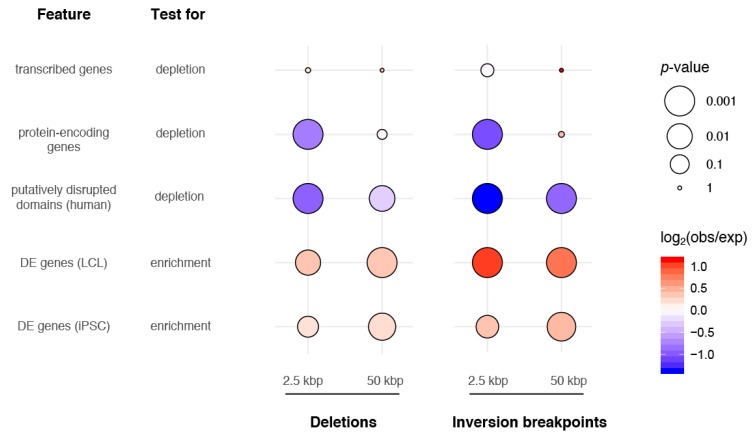
Figure 3.
Enrichment and depletion tests of SVs with genomic features. Both deletions and duplications were tested within 2.5 kbp (resolution of the SV calls) and 50 kbp. All annotated genes (GENCODE v27) and protein-encoding genes were tested for depletion of SVs (top two rows) via permutation testing. Human TADs from the LCL GM12878 were tested for depletion of putatively disrupting SVs (i.e., SVs generating PDTs, third row). Human–chimpanzee DE genes from LCLs and iPSCs were also tested for enrichment in SVs via permutation testing (fourth and fifth rows). Circles are sized proportionally to the negative log of the empirical p-values and colored according to the strength of enrichment or depletion, represented by the log ratio of observed (obs; number of features intersecting SVs) and expected (exp; mean number of features intersecting 1000 permuted coordinate sets) counts.

