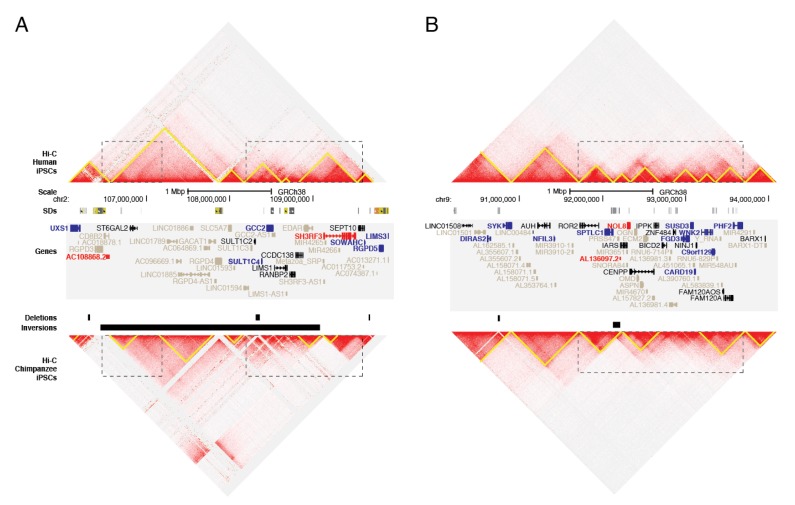
Figure 4.
Genome organization of human and chimpanzee across regions with identified SVs. The Hi-C genomic landscape of human (top) and chimpanzee (bottom) are depicted for iPSCs using Juicebox for (A) chromosome 2q12.2-q13 (chr2:106095001-109905000, GRCh38) and (B) chromosome 9q22.2-q22.32 (chr9:90200001-94010000, GRCh38). Predicted TADs (yellow triangles) were compared between species, noting differences at SVs (dotted boxes) including deletions and inversions. SDs are depicted as colored bars, taken from the UCSC Genome Browser track. Genes showing significant DE in chimpanzee versus humans are colored as red (up in chimpanzee) or blue (down in chimpanzee). Genes not included in the DE analysis are in gray (Tables S11 and S12).

