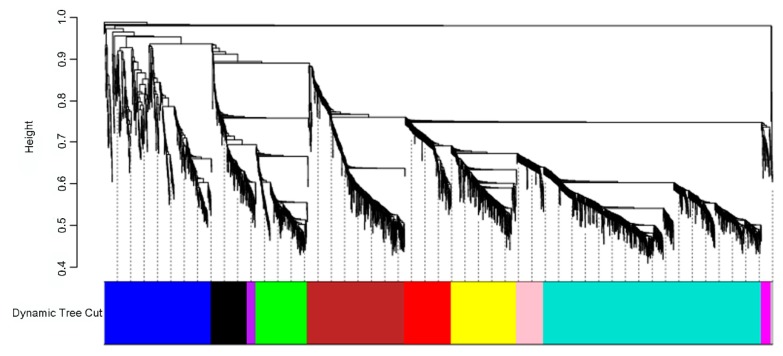
Figure 4.
Identification of gene coexpression modules of all samples data (24 samples, 3000 genes) using average hierarchical linkage clustering; the y-axis denotes the coexpression distance and the x-axis corresponds to genes. Dynamic tree cutting was applied to identify modules by dividing the dendrogram at significant branch points. Modules are displayed with different colors in the horizontal bar.

