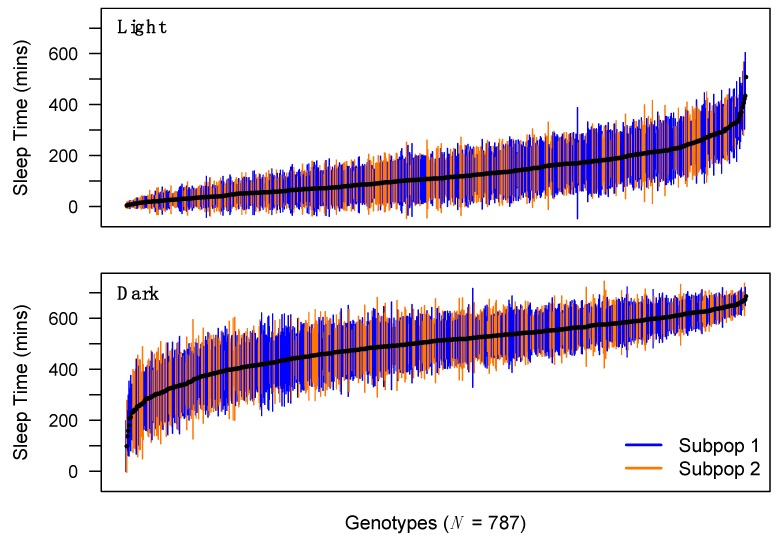
Figure 1.
Distribution of sleep time across DSPRF1 genotypes. Mean sleep time (+/− 1SD) during the light and dark period for each of 787 trans-heterozygous virgin female DSPRF1 genotypes. Genotypes derived from subpopulation 1 (progeny of crosses between pA1 × pB2 Recombinant Inbred Lines (RILs)) and subpopulation 2 (progeny of crosses between pA2 × pB1 RILs) are highlighted in different colors. Since the subpopulations differ slightly in their founder composition, they can exhibit average differences in phenotype. For instance, the subpopulations differ in light-phase sleep time (Welch’s t-test, P < 0.001), but not in dark-phase sleep time (P = 0.97). We corrected for subpopulation-to-subpopulation effects during QTL mapping for all sleep/activity phenotypes.

