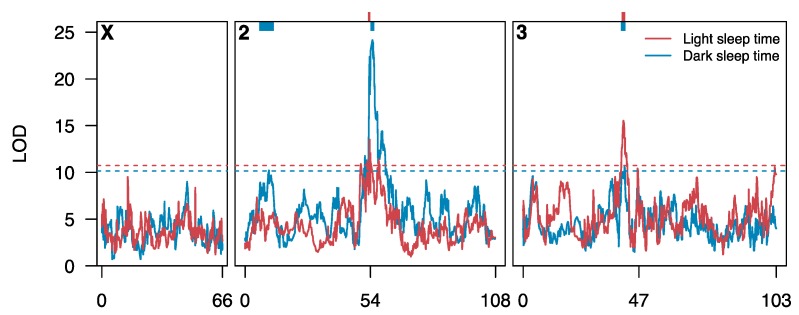
Figure 3.
Quantitative Trait Loci (QTL) identified for sleep time in the DSPRF1. Each curve shows a genome scan for loci affecting sleep time in the light (red) or dark (blue). Genetic positions 54 and 47 on chromosomes 2 and 3, respectively, represent the positions of centromeres. The horizontal dashed lines represent genomewide 5% permutation thresholds (light: LOD = 10.7, dark: LOD = 10.1). The colored bars at the top of the plot represent the 3-LOD drop intervals of the five QTL mapped for sleep time.

