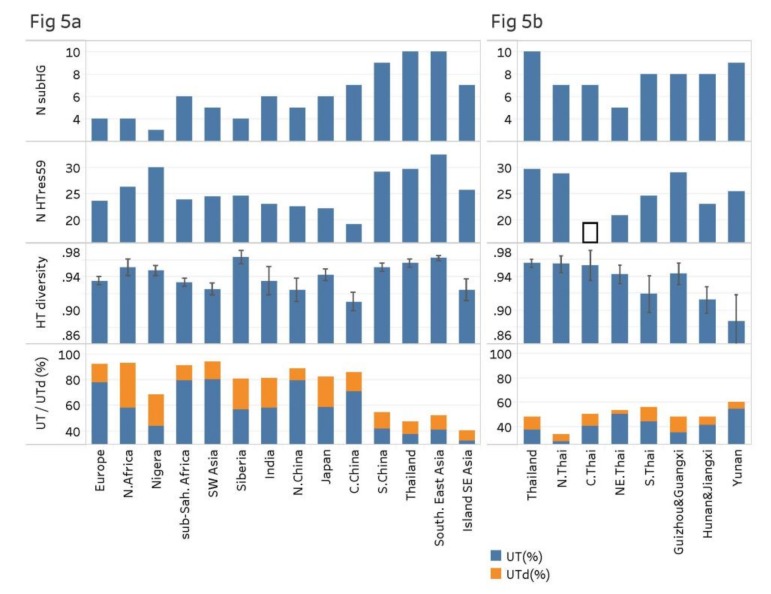
Figure 5.
Genetic diversity in geographical regions: number of sub-haplogroups, number of haplotypes from resampling with sample size 59, Haplotype diversity and proportion of individuals carrying a UT and Utd. (a) Regions across Eurasia and Africa. (b) Sub-regions within Southern East Asia. Black square indicates the number of haplotypes found in the 32 samples from Central Thailand.

